
FIGURE
Fig. S5
Fig. S5
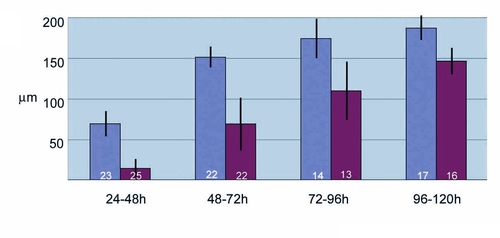
Cyclopamine treatment results in reduction of the GFP expression domain in the ACFP. Average width of GFP expression domain measured from the bottom of notochord in μm is shown with standard deviation. Time of cyclopamine exposure from fertilization in hours (h) is indicated. Blue bars represent 2% ethanol treated controls, bars in purple represent cyclopamine treated embryos. Number of embryos analyzed is indicated at the base of the bars. |
Expression Data
Expression Detail
Antibody Labeling
Phenotype Data
Phenotype Detail
Acknowledgments
This image is the copyrighted work of the attributed author or publisher, and
ZFIN has permission only to display this image to its users.
Additional permissions should be obtained from the applicable author or publisher of the image.
Full text @ BMC Dev. Biol.