
Fig. 4
- ID
- ZDB-FIG-070911-53
- Publication
- Del Monte et al., 2007 - Monitoring Notch1 activity in development: Evidence for a feedback regulatory loop
- Other Figures
- All Figure Page
- Back to All Figure Page
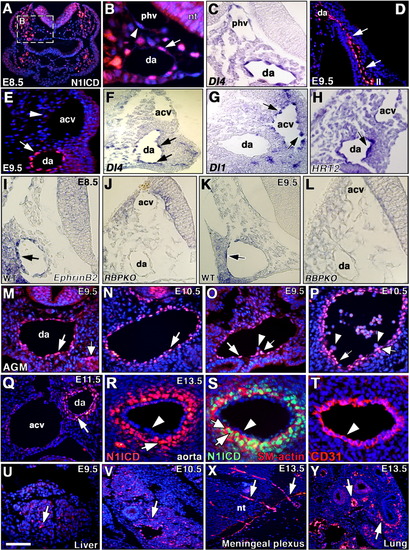
Notch1 activity in vascular development and hematopoiesis. A: General view of a cross-section of an embryonic day (E) 8.5 wild-type (wt) embryo. B: Detail showing N1ICD expression in endothelial cells of dorsal aorta (da, arrow), while cells of the primary head vein (phv, arrowhead) are negative. nt, neural tube. C: Detail showing predominant Delta4 transcription in dorsal aorta. D: Detail showing N1ICD staining in the endothelium (arrows) connecting the dorsal aorta with the second arterial arch (II). E: Detail of an E9.5 section showing N1ICD expression in dorsal aorta (arrow), and lack of expression in anterior cardinal vein (acv, arrowhead). F: Delta4 transcription in E9.5 arterial endothelium (arrows). G: Delta1 transcription in E9.5 venous endothelium (arrows). H: HRT2 transcription in E9.5 arterial endothelium (arrow). I,K: EphrinB2 transcription in arterial endothelium (arrows indicate dorsal aorta) of an E8.5-E9.5 wt embryo. J,L: EphrinB2 transcription is greatly reduced in arterial endothelium of RBPJk mutants. M,N: N1ICD expression in aorta endothelium of anterior AGM region at E9.5-E10.5 (arrows). M: The thick arrow in M indicates the urogenital ridge. O,P: N1ICD expression in endothelium and hematopoietic clusters in posterior AGM region at E9.5-E10.5. Note N1ICD staining in cluster cells closer to the aorta endothelium (thick arrow in O, P), but not in cells budding from the aorta (arrowheads in O, P). Q: At E11.5, N1ICD expression in arterial endothelium begins to disappear, while smooth muscle cells are stained (arrow) and endothelium of anterior cardinal vein (acv) is negative. da, dorsal aorta. R: In E13.5 embryos, N1ICD expression has disappeared from aorta endothelium (arrowhead), while the smooth muscle cells surrounding the artery express N1ICD (arrow). S: Smooth muscle cells showing nuclear N1ICD staining (green, arrow) and cytoplasmic SM-actin staining (red, thick arrow). The arterial endothelium is negative (arrowhead). T: Arterial endothelium stained with anti-CD31/PECAM antibody (red, arrowhead). U,V: N1ICD is expressed in the vasculature of the liver primordium (arrows) at E9.5-E10.5. X,Y: At E13.5, N1ICD stains the vasculature of the meningeal plexus (X, arrows) and arteries of pulmonary vasculature (Y, arrows). nt, neural tube. All are transverse sections. Scale bars = 200 μm in A, 35 μm in B-D,M-Q,U, 50 μm in E-L,Y, 100 μm in R, 45 μm in S,V,Y, 40 μm in T, 80 μm in X. |