
Fig. 3
- ID
- ZDB-FIG-070911-52
- Publication
- Del Monte et al., 2007 - Monitoring Notch1 activity in development: Evidence for a feedback regulatory loop
- Other Figures
- All Figure Page
- Back to All Figure Page
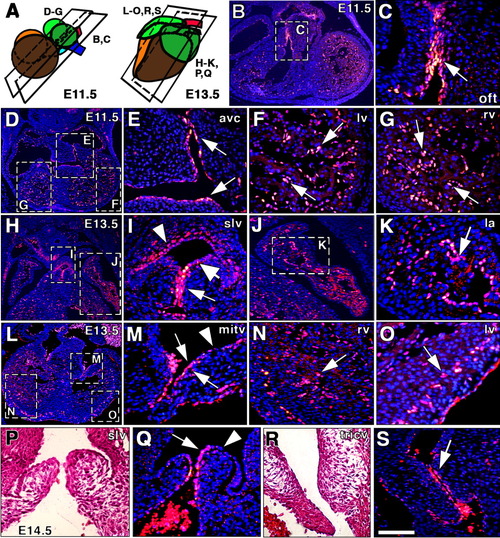
Endocardial Notch1 activity in cardiac valves, and atrial and trabecular development. A: Scheme showing the approximate plane of sections shown in B-S. B,C: General view of an embryonic day (E) 11.5 heart section at the level of the outflow tract (OFT). C: Nuclear N1ICD staining is particularly strong in the OFT endocardium (arrow). D-G: General view of a section at the atrioventricular canal (AVC) level with strong endocardial N1ICD expression (E, arrows). Trabecular endocardium of the left (F) and right (G) ventricles expressed high N1ICD levels (arrows). H,I: At E13.5, N1ICD staining persists in endocardium of the semilunar valve (slv; I, arrow), but decreased in arterial endothelium (I, thick arrow), and was detected in smooth muscle cells of the arterial wall (I, arrowhead). J,K: Detail of N1ICD staining in endocardium lining the developing trabeculae in the left atrium (la; arrow in K). L: General view of an E13.5 heart at the AV valves level. M: Detail showing N1ICD expression in endocardium of the mitral valve (mitv; arrows) and reduced staining in the valve component facing the atrium (arrowhead). N: Detail of N1ICD endocardial staining in the right ventricle (arrow). O: N1ICD staining was also strong in the developing coronary vessels of the left ventricle (arrow). P-S: At E14.5, N1ICD was restricted to the endocardial component of the valves. P: Morphology of the semilunar valve. Q: Note N1ICD endocardial expression (arrow) and its exclusion from the arterial endothelium (arrowhead) of the semilunar valve. R: Morphology of the tricuspid valve (tricv). S: N1ICD expression in endocardial lining of the tricuspid valve (arrow). Scale bars = 250 μm in B,D, 200 μm in H,L, 100 μm in C,E-G, 80 μm in I-K,M-S. |