
Fig. 5
- ID
- ZDB-FIG-070118-17
- Publication
- Liu et al., 2007 - Cloning and expression analysis of cadherin7 in the central nervous system of the embryonic zebrafish
- Other Figures
- All Figure Page
- Back to All Figure Page
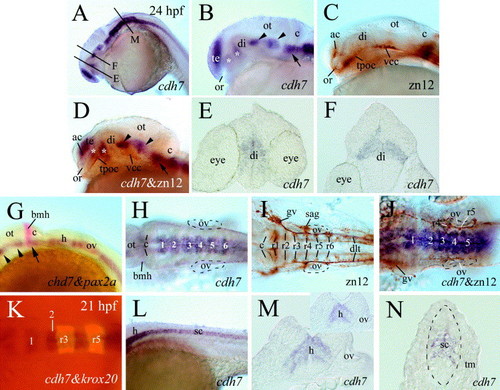
cdh7 expression in 24 hpf zebrafish embryos (K is from 21 hpf). Zebrafish embryos processed for cdh7 whole mount in situ hybridization are shown in (A, B, E, F, H, L–N). (C and I) Embryos processed for zn12 whole mount immunostaining, while (D and J) show embryos processed for double-labeling [cdh7 in situ hybridization (purple) followed by zn12 immunostaining (brown)]. (G) From a double-labeling experiment using digoxigenin-labeled cdh7 (purple) and fluorescein-labeled pax2a (red) cRNA probes. (K) An embryo processed for double-labeling experiment using the digoxigenin-labeled cdh7 probe (dark) and fluorescein-labeled krox20 probe (fluorescent). (A–D and G) Lateral views of the head region with anterior to the left and dorsal up. (E, F, M, and N) Cross sections (dorsal up) from embryos processed for cdh7 whole mount in situ hybridization. Asterisks in (B and D) indicate cdh7 expressing domains in the diencephalon. Arrowheads and arrow (B, D and G) indicate corresponding cdh7 expressing domains in the mid- and hindbrains. The section levels of (E, F, and M) indicated by corresponding letters in (A). (H–K) Dorsal views (anterior to the left) of higher magnification of the hindbrain region. The otic vesicles in (H–J) are outlined by dashed lines. The white numbers in (H, J, and K) label swellings of cdh7 expression in the hindbrain. (M) Section from a swelling in cdh7 expression in the hindbrain at the otic vesicle level, while the inset in (M) shows a section from a restriction in cdh7 expression in a similar region. (L) Lateral view of the mid-trunk region of the embryo. The spinal cord region in (N) is outlined by the dashed line. Abbreviations: ac, anterior commissure; bmh, boundary of the mid- and hindbrains; di, diencephalon; gv, trigeminal ganglion; ot, optic tectum; ov, otic vesicle; r1–r6, rhombomeres 1–6; sag, statoacoustic ganglion; te, telencephalon; tm, trunk muscles; tpoc, tract of postoptic commissure; vcc, ventrocaudal cluster. Other abbreviations are the same as in Fig. 4. |
| Genes: | |
|---|---|
| Fish: | |
| Anatomical Terms: | |
| Stage Range: | 20-25 somites to Prim-5 |
Reprinted from Gene expression patterns : GEP, 7(1-2), Liu, B., Joel Duff, R., Londraville, R.L., Marrs, J.A., and Liu, Q., Cloning and expression analysis of cadherin7 in the central nervous system of the embryonic zebrafish, 15-22, Copyright (2007) with permission from Elsevier. Full text @ Gene Expr. Patterns