
Fig. 1
- ID
- ZDB-FIG-051219-7
- Publication
- Ellingsen et al., 2005 - Large-scale enhancer detection in the zebrafish genome
- Other Figures
- All Figure Page
- Back to All Figure Page
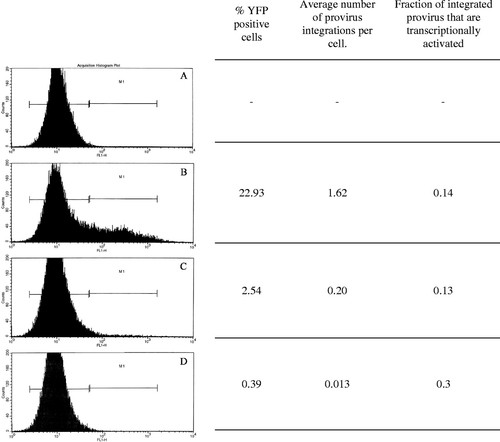
FACS analysis of zebrafish fibroblast cells (Pac2) infected with serial dilutions of the viral vector CLGY. Cells were infected with pseudotyped virus. Two days post infection, cells were harvested and analyzed for YFP expression by flow cytometry using a FACSCalibur Flow Cytometry Analyzer (Becton Dickinson, USA). (A) Uninfected cells. (B) Cells infected with concentrated CLGY stock (1.1x10⁸ CFU/ml). (C) Cells infected with 1:10 dilution of concentrated virus stock. (D) Cells infected with 1:100 dilution of concentrated virus stock. To calculate average number of provirus integrations per cell, real-time quantitative PCR was performed on genomic DNA isolated from infected cells. Genomic DNA from cells containing two copies of an integrated provirus per cell was used as reference for provirus number, while variations in template amount were normalized against an endogenous target sequence (Chen et al., 2002) |