
Fig. 6
- ID
- ZDB-FIG-050426-1
- Publication
- Down et al., 2005 - Cloning and expression of the large zebrafish protocadherin gene, Fat
- Other Figures
- All Figure Page
- Back to All Figure Page
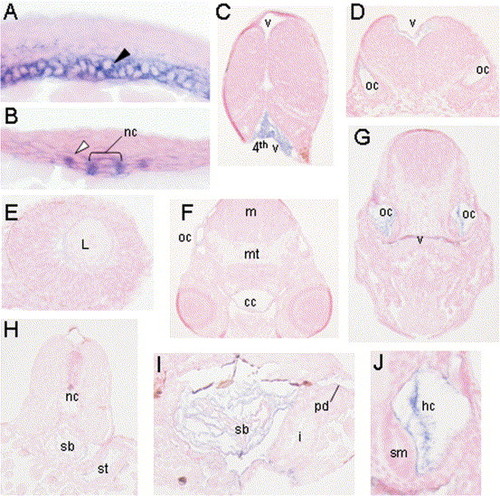
Expression offat RNA by in situ hybridisation. Whole mount is situ hybridised embryos were paraffin embedded and sectioned. A DIG labelled probe against EGFR5-FC2 of fat was used at a variety of developmental time points. In longitudinal cross section at 14 hpf the stained notocord cells can be clearly seen, as the main supporting structure of the embryo at this stage the cells have just started to form the characteristic open vacuoles (A). In transverse section, the large vacuoled notochord cells are stained (nc), the somites lie laterally, and the expression is restricted to the medial somitic epithelium (open arrows), and the adaxial cells, which will later develop into myotome (B). In longitudinal cross section of the posterior midbrain at 42 hpf expression can be seen in the cells lining the 4th and 3rd ventricle (v) including the ventricular zone (C). In transverse section at 50 hpf through the hindbrain, the otic capsules (oc) and the lining of the ventricle show expression (D). On longitudinal section it is only the thin epithelial lining of the lens that clearly but modestly shows weak expression of fat (E). At this same time point expression can be seen on the apical surface of cells lining the stomach (st) and the swim bladder (sb) directly ventral to the notocord (nc) (H). Later in development at 100 hpf, expression is restricted to the lining of the cranial cavity (cc) and the otic capsules (oc) (F). Posteriorly, expression can be seen on the sensory macula of the otic capsules (oc) with the lining of the 4th ventricle (v) also prominent dorsally (G). In cross section of the otic capsule at 150 hpf it is the apical surface of the macula (sm) and the processes of the sensory hair cells expressing (J). At this stage the lining of the swim bladder (sb) and the pronephric duct (pd) are expressing (I). Abbreviations: m, myelencephalon; mt, midbrain tegmentum; I, intestine. Magnification: (C), (D), (F), (G), (H) 20×, (E), (I) 40×, (A), (B), (J) 63x. |
| Gene: | |
|---|---|
| Fish: | |
| Anatomical Terms: | |
| Stage Range: | 10-13 somites to Day 6 |
Reprinted from Gene expression patterns : GEP, 5(4), Down, M., Power, M., Smith, S.I., Ralston, K., Spanevello, M., Burns, G.F., and Boyd, A.W., Cloning and expression of the large zebrafish protocadherin gene, Fat, 483-490, Copyright (2005) with permission from Elsevier. Full text @ Gene Expr. Patterns