
- Title
-
Myosin1G promotes Nodal signaling to control zebrafish left-right asymmetry
- Authors
- Kurup, A.J., Bailet, F., Fürthauer, M.
- Source
- Full text @ Nat. Commun.
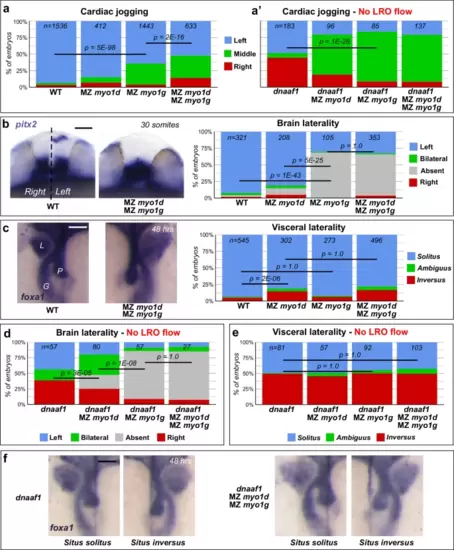
Myo1G regulates heart and brain LR asymmetry independent of the LRO flow. a, a′ Quantification of cardiac jogging indicates that MZ myo1g mutants present laterality defects that are enhanced in MZ myo1d; MZ myo1g double mutants (a). Concomitant inactivation of the LRO flow (through dnaaf1 mutation) reveals that MZ myo1d/g mutations enhance the cardiac jogging defects of flow-deficient animals (a′). b Brain asymmetry is impaired in MZ myo1g single and MZ myo1d; MZ myo1g double mutants. Frontal views of pitx2 expression at 30 somites, dorsal up. c MZ myo1g mutants do not show visceral LR defects. L liver, G gut, P pancreas. Dorsal views of foxa1 expression at 48 h, anterior up. d MZ myo1d/g inactivation enhances the brain laterality phenotypes of LRO flow-deficient dnaaf1 mutants. e, f Visceral laterality phenotypes of dnaaf1 mutants are unaffected by myo1d/g inactivation. f Dorsal views of foxa1 expression at 48 h, anterior up. Pictures are derived from the data set quantified in (e). Scale bars: 50 µm. All p values were obtained using non-directional statistical tests. Complete numerical and statistical information for all experiments are provided in the Source Data files. |
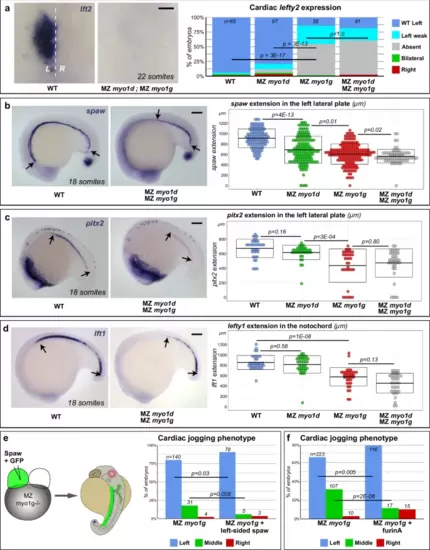
MZ myosin1g mutants display impaired Nodal signaling. a MZ myo1g single and MZ myo1d; MZ myo1g double mutants fail to display asymmetric lft2 expression in the cardiac primordium. Dorsal views at 22 somites, anterior up. b–d MZ myo1d/g mutants display a reduced anterior propagation of the expression of the Nodal ligand spaw (b, see also Supplementary Fig. 3a), the Nodal effector pitx2 (c, see also Supplementary Fig. 3b) and the Nodal feedback inhibitor lft1 (d). Lateral views at 18 somites, anterior left, dorsal up. Box plots in (b–d) indicate mean values ± SD. e Left-sided expression of Spaw RNA partially rescues the cardiac jogging defects of MZ myo1g mutants (see also Supplementary Fig. 4a, b). f Enhancing Spaw signaling through furinA RNA injection similarly rescues the cardiac jogging defects of MZ myo1g mutants. Scale bars: a 50 µm, b–d 100 µm. All p values were obtained using non-directional statistical tests. Complete numerical and statistical information for all experiments are provided in the Source Data files. |
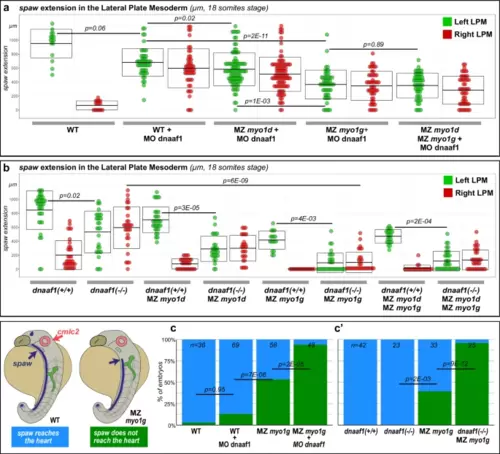
Myosin1 proteins regulate spaw expression independently of the LRO flow. a, b Quantification of spaw extension in the Left (green dots) and Right (red dots) LPM of 18 somites stage LRO flow-deficient dnaaf1 morphant (a) or dnaaf1 mutant (b) embryos. myo1d/g loss of function causes a significant reduction of the antero-posterior extension of spaw expression in both the Left and the Right LPM. To allow direct comparison, mutant animals in a, b are derived from the same genetic background. Box plots in a, b indicate mean values ± SD. c, c′ Double in situ hybridization for spaw and the cardiac marker cmlc2/myl7 (see Supplementary Fig. 5 for pictures) reveals that spaw expression reaches the cardiac primordium in most WT control and LRO flow-deficient dnaaf1 morphant (c) or dnaaf1 mutant (c′) embryos, but fails to do so upon inactivation of myo1g. All p values were obtained using non-directional statistical tests. Complete numerical and statistical information for all experiments are provided in the Source Data files. |
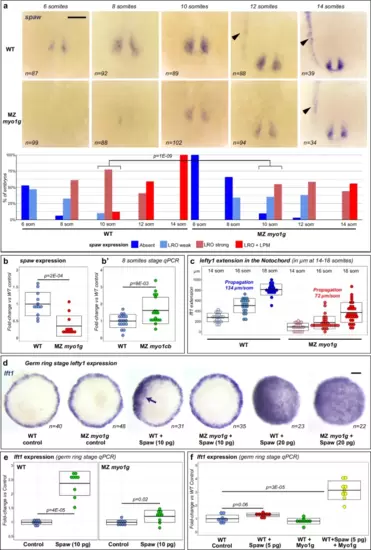
Myo1G promotes Spaw signaling. a Time-course analysis of spaw expression indicates that initiation of spaw expression at the LRO and propagation to the Left LPM (black arrowhead) are delayed in MZ myo1g mutants. Vegetal views of the LRO region, anterior up. b, b′ qPCR analysis of spaw expression confirms that spaw levels are significantly reduced in MZ myo1g mutants (b). Conversely, spaw expression increases in Maternal Zygotic myo1cb (MZ myo1cb) mutants (b′, see also Supplementary Fig. 7b). c MZ myo1g mutants present a significantly reduced (p = 2E-05) rate of anterior-ward propagation of lft1 expression in the notochord (see also Supplementary Fig. 9a). d, e MZ myo1g mutants display a weaker induction of the nodal target gene lft1 in response to Spaw overexpression. d Animal pole views of germ ring stage embryos. While high amounts (20 pg) of Spaw RNA induce a similar lft1 induction in MZ myo1g mutants and wild-type controls, myo1g-deficient embryos present a reduced response to moderate amounts (10 pg) of Spaw RNA (arrow indicates ectopic expression, see Supplementary Fig. 9b for quantification). e qPCR analysis confirms that equal amounts of Spaw RNA induce a reduced lft1 induction response in MZ myo1g mutants compared to WT Control embryos from the same genetic background. f Conversely, the overexpression of Myo1G potentiates the capacity of low amounts (5 pg) of Spaw RNA to induce ectopic lft1. Scale bars: 100 µm. Box plots in b, b′, c, e, f indicate mean values ± SD. All p values were obtained using non-directional statistical tests. Complete numerical and statistical information for all experiments are provided in the Source Data files. |
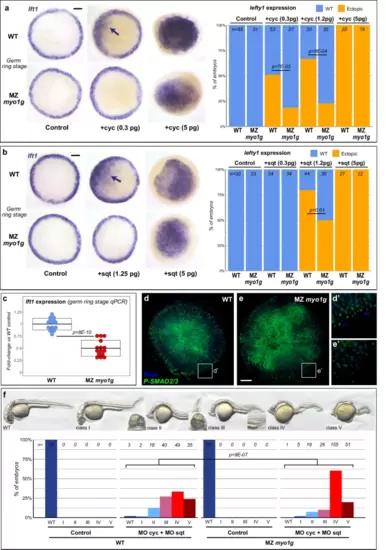
Myo1G promotes signaling by different Nodal ligands. a, b MZ myo1g mutants display reduced lft1 induction in response to ectopic expression of the Nodal ligands cyclops (cyc, a) and squint (sqt, b). Animal pole views of germ ring stage embryos, arrows indicate patches of ectopic lft1 expression. c qPCR indicates that MZ myo1g mutants present a mild decrease in the endogenous expression levels of the Nodal target gene lft1. Box plots in c indicate mean values ± SD. d, e MZ myo1g mutants present a reduced immunoreactivity for activated Phospho-SMAD2/3 (n = 25 WT and 31 MZ myo1g mutant embryos from 2 independent experiments). Animal pole views of germ ring stage embryos. Scale bar: 100 µm. f Morpholino knockdown of cyc and sqt (MO cyc + MO sqt) elicits stronger Nodal loss of function phenotypes in MZ myo1g mutants than in WT controls. Nodal loss of function phenotypes at 32 hpf were categorized into five classes: class I (partial cyclopia), class II (complete cyclopia), class III (partial loss of the notochord), class IV (complete loss of the notochord), and class V (loss of posterior neural structures). All p values were obtained using non-directional statistical tests. Complete numerical and statistical information are provided in the Source Data files. |
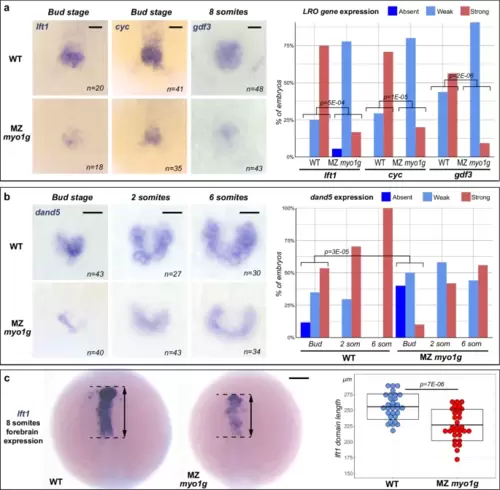
Defective Nodal pathway gene expressions in early segmentation stage MZ myo1g mutants.a MZ myo1g mutants present a reduced expression of the Nodal ligand cyc and the Nodal feedback antagonist lft1 in the LRO/tail bud region of bud stage embryos. Mutant embryos also present a reduced expression of the Nodal ligand gdf3 in the eight-somites stage LRO. b MZ myo1g mutants display a reduced expression of the Nodal signaling antagonist dand5 from the bud stage onwards. a, b show vegetal views of the LRO/tail bud region, anterior up. c Eight-somites stage MZ myo1g mutants present a reduction in the antero-posterior extension of lft1 expression in the anterior brain. Dorsal views of the brain, anterior up. Box plots in c indicate mean values ± SD. Scale bars: a 50 µm, b, c 100 µm. All p values were obtained using non-directional statistical tests. Complete numerical and statistical information are provided in the Source Data files. |
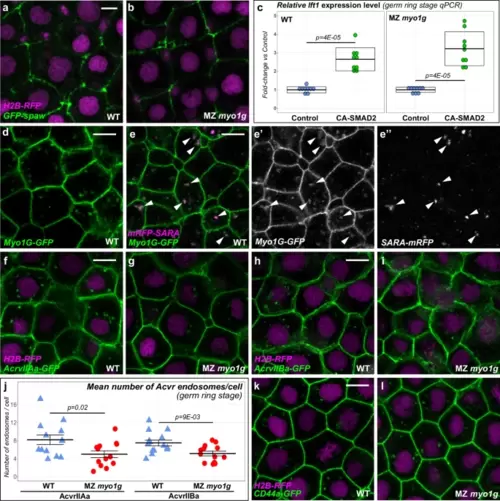
Myo1G regulates nodal receptor trafficking. a, b Spaw-GFP localization is similar in WT (n = 20) and MZ myo1g mutants (n = 17). H2B-RFP was injected as a tracer to ascertain that embryos that had received equal amounts of RNA (see Supplementary Fig. 11a for quantification). c A constitutively activated form of the Nodal signal transducer SMAD2 (CA-SMAD2) elicits similar responses in WT and MZ myo1g mutants. Box plots in c indicate mean values ± SD. d Myo1G-GFP is detected at the cell cortex and in intracellular compartments (n = 10). e, e’, e” Myo1G-GFP is present on endosomes positive for the TGFβ signaling adapter SARA (n = 24, see also Supplementary Fig. 12a, b). f–j MZ myo1g mutants present a reduced number of endosomes positive for the Nodal receptors Acvr2Aa-GFP (f, g, j, n = 13 WT and 13 MZ myo1g mutant embryos) and Acvr2Ba-GFP (h–j, n = 14 WT and 13 MZ myo1g mutant embryos). In j data points represent the mean number of endosomes per cell for a particular embryo and lines indicate the overall mean ± SEM. k, l MZ myo1g mutants and WT siblings present a similar number of CD44a-positive endosomes (n = 7 WT and n = 7 MZ myo1g mutant embryos, see Supplementary Fig. 11b for quantification). a, b, d–i, k, l, animal pole views, germ ring stage. Scale bars: 10 µm. All p values were obtained using non-directional statistical tests. Complete numerical and statistical information are provided in the Source Data files. |
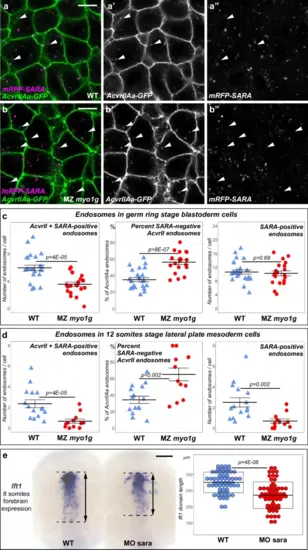
MZ myo1g mutants present stage-specific endosomal trafficking defects. a, b MZ myo1g mutants present an increased number of SARA-negative AcvrIIAa endosomes (white arrowheads). Animal pole views of germ ring stage blastoderm cells. Scale bars: 10 µm. c, d Quantifications of AcvrIIAa/SARA-positive endosomes in WT control and MZ myo1g mutant cells in the germ ring stage blastoderm (c) and the 12 somites stage Lateral Plate Mesoderm (d, see also Supplementary Fig. 12c, d). Left panels: Mean number of AcvrIIAa-GFP and mRFP-SARA double-positive endosomes per cell. Middle panels: Percentage of the total number of AcvrIIAa endosomes per cell that are SARA-negative. Right panels: Number of SARA endosomes per cell. The absolute number of AcvrIIAa+SARA double-positive endosomes decreases and the fraction of SARA-negative AcvrIIAa endosomes increases both in the early blastoderm (c) and later lateral plate mesoderm (d). In contrast, the mean number of SARA endosomes per cell remains unchanged in MZ myo1g mutants at the early germ ring stage while being significantly decreased at 12 somites. In c, d data points represent the mean number of endosomes per cell for a particular embryo and lines indicate the overall mean ± SEM. e Eight-somites stage SARA morphants (MO sara) present a reduction in the antero-posterior extension of forebrain lft1 expression. Dorsal views of the brain, anterior up. Scale bar: 100 µm. Box plots in e indicate mean values ± SD. All p values were obtained using non-directional statistical tests. Complete numerical and statistical information for all experiments are provided in the Source Data files. |