FIGURE SUMMARY
Title

Developmental Toxicity of PEDOT:PSS in Zebrafish: Effects on Morphology, Cardiac Function, and Intestinal Health

Authors
Yang, G., Gou, D., Bu, L.K., Wei, X.Y., Hu, H., Huo, W.B., Sultan, M., Pei, D.S.
Source
Full text @ Toxics

The experimental design for investigating toxicity effects of PEDOT:PSS in zebrafish.

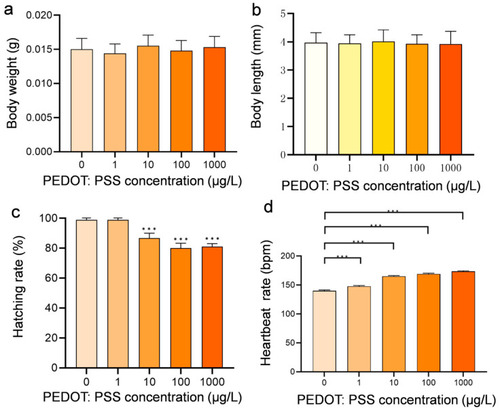
The developmental indexes of zebrafish after exposure to different concentrations of PEDOT:PSS. The body weight (a) and body length (b) of zebrafish larvae were measured at 120 hpf. The hatching rate (c) and heartbeat rate (d) of zebrafish larvae were recorded at 72 and 48 hpf, respectively. Each experiment was repeated three times, and the results are presented as mean ± standard deviation. Statistical analysis showed that there was a significant difference in heartbeat rate between the control group and the exposed group (*** p < 0.001).

Expression levels of genes related to oxidative stress in zebrafish. (aj) are the expression levels of bax, bcl2, cat, cox-1, Cu/Zn sod, gpx, gstp2, keap1, Mn sod, and ucp2 after exposure to different concentrations of PEDOT:PSS, respectively. The experiment was repeated three times, and the results were expressed as mean ± standard deviation. The findings indicate a statistically significant difference between the control and exposure groups, with * p < 0.05, ** p < 0.01, and *** p < 0.001.

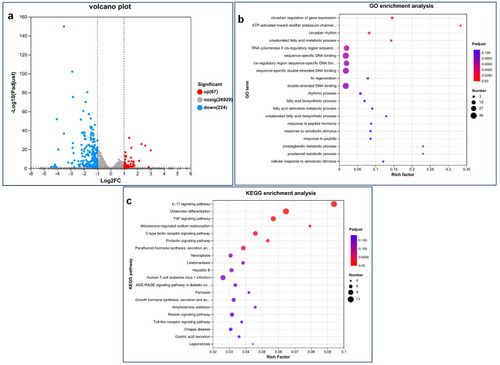
Transcriptome analysis of zebrafish at 120 hpf after exposure to 1 mg/L PEDOT:PSS. (a) The results were presented in a volcano diagram, where the red and blue dots represent significantly up- and downregulated genes, respectively. The grey dots signify no significant gene expression changes. (b,c) Our study identified the top 20 GO terms (b) and KEGG pathways for enrichment level (c).

The results of the behavioral tests conducted on zebrafish at 120 hpf. (a) Total distance movement; (b) Mean velocity; (c) Maximum acceleration; (d) Minimum acceleration. The experiment was repeated five times, and the results are expressed as mean ± standard deviation. There was a statistically significant difference between the control and exposure group with * p < 0.05 and *** p < 0.001.

In situ hybridization results of nppa (a) and cmlc2 (b). Control on the left, 1 mg/L PEDOT:PSS treatment on the right for both nppa and cmlc2. The region of interest is denoted by red or white circles. (c,d) The semi-quantitative results of (a,b). The red and white dash lines indicated the signal regions. There was a statistically significant difference between the control and exposure group with *** p < 0.001.

Visualization of intestinal cell defects in zebrafish after exposure to 1 mg/L PEDOT:PSS. At 120 hpf, the entire zebrafish intestinal tract was analyzed and visualized for control groups (a) and target groups treated with 1 mg/L PEDOT:PSS (b). The defects of intestinal cells are indicated by arrows. (c) The quantitative result of the decreased value of intestinal cells. There was a statistically significant difference between the control and exposure group with *** p < 0.001.

Summary of toxicity effects of PEDOT:PSS in zebrafish.

Acknowledgments
This image is the copyrighted work of the attributed author or publisher, and ZFIN has permission only to display this image to its users. Additional permissions should be obtained from the applicable author or publisher of the image. Full text @ Toxics