FIGURE SUMMARY
Title

Developmental loss of NMDA receptors results in supernumerary forebrain neurons through delayed maturation of transit-amplifying neuroblasts

Authors
Napoli, A.J., Laderwager, S., Zoodsma, J.D., Biju, B., Mucollari, O., Schubel, S.K., Aprea, C., Sayed, A., Morgan, K., Napoli, A., Flanagan, S., Wollmuth, L.P., Sirotkin, H.I.
Source
Full text @ Sci. Rep.

grin1−/− fish do not show gross morphological changes in brain structure. (AF) Nissl stained 5-micron coronal sections of a 5 dpf wild-type (A, C, & E) and a grin1−/− (B, D, & F) fish at the anterior (A & B), mid (C & D) and posterior (E & F) forebrain. Measurement locations indicated in (C): yellow solid line, dorsoventral height measured at midline; dashed line, mediolateral width measured at widest aspect of the brain; and dotted line, hemispheric area. (GI) Box and whisker plots indicating median value, interquartile ranges, and maximum and minimum values, for coronal morphometric measurements of dorsoventral height (G), mediolateral width (H) and hemispheric area (I). In this and all subsequent figures, points represent individual values for each fish. (J & K) External brain size proxy measurements (J) and total area of fish measured in lateral view (K). Inset to (J): dorsal (upper) and lateral (lower) views with measurement locations indicated in red dashed line (optic tectum width, TeO), dotted line (eye diameter, ED), and solid line (eye to ear distance, EE). (l) Total hemispheric cell counts of 5 dpf fish performed on representative sections at anterior, mid, and posterior levels of the forebrain (A–F) in wild-type and grin1−/− fish. Significance (t-test) is indicated (*p < 0.05; ns, not significant). For specific sample sizes and statistical values see Table 2.

grin1−/− fish have increased cell densities throughout the forebrain. (AD) Nissl stained 5-micron coronal sections of a 3 dpf wild-type (A) and a grin1−/− (B) fish at the precommissural anterior telencephalon, or of a 5 dpf wild-type (C) and a grin1−/− (D) fish in the anterior telencephalon at the level of the anterior commissure. (E & F) Box and whisker plots of cell density in 9 different anatomical regions in wild-type and grin1−/− fish at 3 dpf (E) and 5 dpf (F). (G) Data in (E) and (F) expressed as Cohen’s d effect sizes demonstrating magnitude and directionality of changes (positive value indicates greater cell density in grin1−/− fish, negative value indicates greater cell density in wild-type fish) in cell density between wild-type and grin1−/− fish, at 3 and 5 dpf, in each anatomical region assayed. Significance (t-test) is indicated (*p < 0.05, **p < 0.01, ***p < 0.001). For specific sample sizes and statistical values see Table 3.

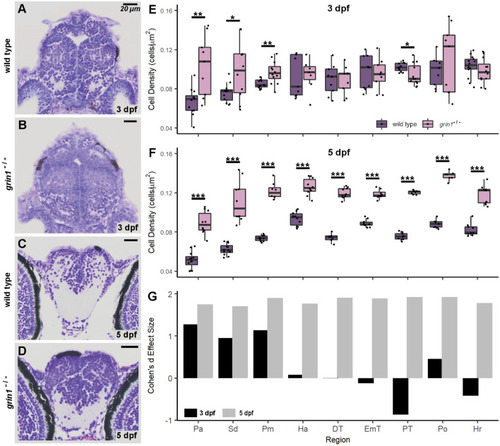
NMDA receptors suppress neuron proliferation in the forebrain. (AF) PSA-NCAM (red) and PCNA (green) expression with DAPI counterstain in wild-type (A, C, & E) or grin1−/− (B, D, & F) fish at 5 dpf either in the precommissural telencephalon (A & B), postcommissural telencephalon (C & D), or diencephalon (E & F). Brain schematics above images indicate the gross anatomical regions sampled. Brain schematics after Mueller & Wullimann (2016). Arrowheads indicate example cells coexpressing PSA-NCAM and PCNA. (G) Line graph with points showing the mean PSA-NCAM corrected fluorescence intensity (CFI) at each anatomical level assayed from anterior to posterior (left to right). Ribbon surrounding line graph indicates standard error of the mean. Anatomical levels are numbered according to Mueller & Wullimann (2016) (see "Materials and methods"). Wild type n = 16; grin1−/− n = 9. t-test, p = 7.3e−05. (t-test was performed as a comparison of the aggregate mean CFI across the forebrain for each group). (HJ) Box and whisker plots of CFI values within each gross anatomical region. Wild type and grin1−/− sample sizes and p value (t-test): Precommissural telencephalon (H), 16, 7; p = 1.7e−06. Postcommissural telencephalon (I), 11, 9; p = 4.4e−05. Diencephalon (J), 12, 9; p = 0.0003. Significance (t-test) is indicated (***p < 0.001).

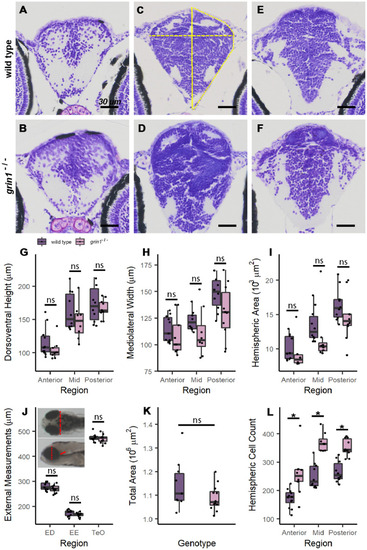
Radial glia are not increased in the forebrain of grin1−/− fish. (AF) GFAP expression (index of RGCs) of 3 dpf wild-type (A, C, & E) and grin1−/− (B, D, & F) fish at three gross anatomical levels of the forebrain (see "Materials and methods"). Brain schematics above images indicate the gross anatomical regions sampled. Brain schematics after Mueller & Wullimann (2016). (GI) Box and whisker plots of CFI analysis. Wild type and grin1−/− sample sizes and p value (t-test): Precommissural telencephalon (G), 7, 7; p = 0.38. Postcommissural telencephalon (H), 7, 7; p = 0.17. Diencephalon (I), 6, 7; p = 0.53. Significance (t-test) is indicated (ns, not significant).

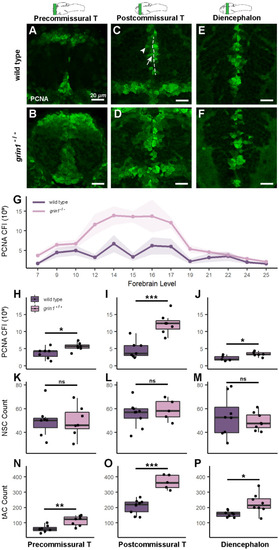
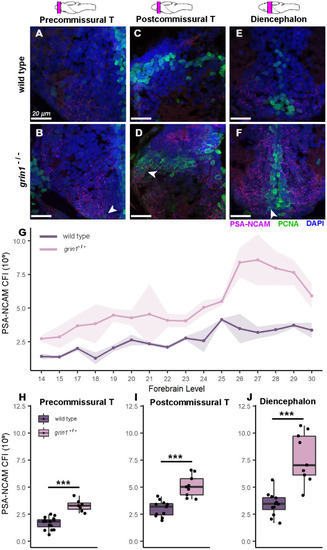
NMDA receptors suppress proliferation in neuroblasts (transit amplifying cells). (AF) PCNA expression in wild-type (A, C, & E) and grin1−/− (B, D, & F) fish at 3 dpf in the precommissural telencephalon (A & B), postcommissural telencephalon (C & D) and diencephalon (E & F). PCNA is enriched in abventicular and cell rich regions of the parenchyma in the mutant fish. In (C), sample of PVZ (dotted line), example RGC at PVZ (arrow), example abventricular tAC (arrowhead). Brain schematics above images indicate the gross anatomical regions sampled. Brain schematics after Mueller & Wullimann (2016). (G) Line graph with points showing the mean corrected fluorescence intensity (CFI) for each genotype, at each anatomical level assayed from anterior to posterior (left to right). Ribbon surrounding line graph indicates standard error of the mean. Anatomical levels are numbered according to Mueller & Wullimann (2016) (see "Materials and methods"). Wild type n = 7; grin1−/− n = 7. t-test, p = 0.0009. (HP) Box and whisker plots of different analysis of three anatomical levels: precommissural telencephalon, postcommissural telencephalon, and diencephalon. Wild type and grin1−/− sample sizes and p value (t-test): (HJ) PCNA CFI values: precommissural telencephalon (H) 7, 7, p = 0.03; postcommissural telencephalon (I) 7, 7, p = 0.0003; diencephalon (J) 5, 7, p = 0.01. (KM) PCNA+ NSC counts: precommissural telencephalon (K) 7, 7, p = 0.95; postcommissural telencephalon (L) 9, 5, p = 0.54; diencephalon (M) 8, 8, p = 0.54. (NP) PCNA+ tACs cell counts: precommissural telencephalon (N) 7, 7, p = 0.005; postcommissural telencephalon (O) 9, 5, p = 5.1e−05; diencephalon (P) 8, 8, p = 0.02. Significance (t-test) is indicated (* p < 0.05, **p < 0.01, ***p < 0.001; ns, not significant).

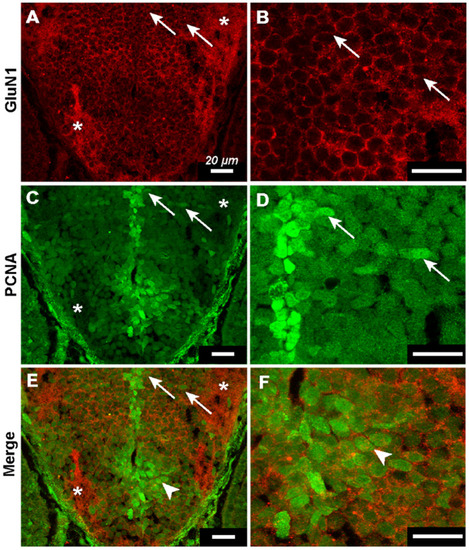
Transit amplifying cells express GluN1. (AF) Immunohistochemistry against GluN1 and PCNA in 3 dpf wild-type fish. Panels on the right are magnified versions of those on the left. Asterisks indicate example regions of neuropil in (A, C, & E). (A & B) GluN1 channel showing robust plasmelemmal and neuropilar dendritic expression of GluN1. Arrows indicate example cells in abventicular and cell-rich parenchymal locations (A) and illustrate plasmelemmal GluN1 expression (B). (C & D) PCNA channel showing ventricular PCNA+ NSCs and abventricular and cell-rich parenchymal PCNA+ tACs cells. Arrows indicate the same cells as in (A & B) and illustrate that the same cells express both PCNA and GluN1. (E & F) Merged GluN1 and PCNA channels. Arrows indicate same cells as in (A, B, C, & D) arrow heads indicate example PCNA+ tAC with GluN1 puncta.

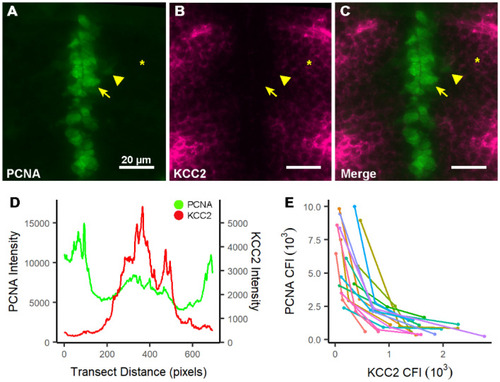
KCC2 and PCNA expression are inversely correlated in the forebrain of wild-type fish. (AC) A representative section from the diencephalon of 3 dpf fish showing PCNA (A) and KCC2 (B) expression, and merged image (C). Symbols indicate the same cells in each image: arrows, PCNA+ cell with high expression near the PVZ; arrowhead, a PCNA+ cell with moderate to low expression at an abventricular position; and asterisk, a PCNA cell in a perineuropilar position. These cells have no, moderate, and high KCC2 expression, respectively. (D) Line graph of corrected line fluorescence (CLF) for PCNA (green) and KCC2 (red) from a representative transect in the telencephalon, showing the inverse expression relationship between PCNA and KCC2. The transect was drawn from the midline PVZ to the tela choroidea at the outermost aspect of the brain. (E) Scatter plot showing the inverse relationship between PCNA and KCC2 expression in individual wild-type cells. Each set of 3 color coded dots with their connecting line represents a triplet of cells from one specimen. For each sampling, cell 1 is within the abventricular zone with high PCNA expression (A, B, & C, arrow), cell 2 is within the cell-rich parasagittal zone with moderate PCNA expression (A, B, & C, arrowhead), and cell 3 is in the peri-neuropilar zone with low PCNA expression (A, B, & C, asterisk). Scatter indicates the PCNA and KCC2 CFI value within each individual cell represented as PCNA vs. KCC2. n = 16.

Loss of NMDA receptor function results in reduced KCC2 expression. (A & B) Representative images of the diencephalon of a wild-type (A) and grin1−/− (B) fish. Dashed line is the midline proliferative zone, whereas the solid lines represent the transects drawn for corrected line fluorescence intensity analysis (CLFI). The dorsal transect (labeled D) passes through the dorsal thalamus, while the ventral transect (labeled V) passes through the posterior tuberculum. (C & D) Line graphs showing CLFI for dorsal (C) and ventral (D) transects in wild-type (top) and grin1−/− (bottom) fish. Low opacity lines represent individual traces. Bold lines represent the averages of all traces binned in increments of 0.5% along the transect length. Peaks represent points at which the transect crosses the plasma membrane. The dotted orange line represents the distance along the transect at which the average intensity reaches half the wild-type average maximum value. (E & F) Representative images of the cell-rich region of the anterior telencephalon in wild-type (E) and grin1−/− (F). Asterisks indicate regions of the anterior commissure in each image and the area above the dashed line indicates the cell-rich region surrounding the anterior commissure. (G) Box and whisker plot of normalized CFI for the cell rich region surrounding the anterior commissure. Wild type n = 8, grin1−/− n = 8, t-test p = 0.01. Significance (t-test) is indicated (*p < 0.05)

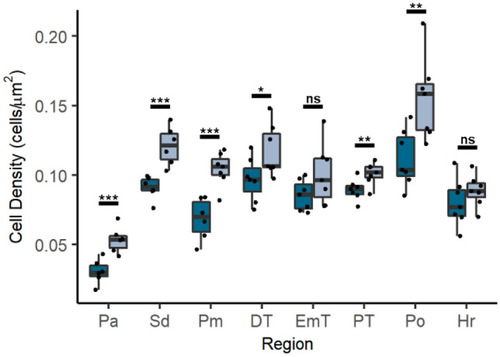
NMDA receptor ionotropic function is required suppression of neurogenesis. Box and whisker plot of cell density in 8 anatomical regions in control and MK-801 treated fish at 5 dpf. Significance (t-test) is indicated (* p < 0.05, **p < 0.01, ***p < 0.001; ns, not significant). For specific sample sizes and statistical values see Table 4.

Acknowledgments
This image is the copyrighted work of the attributed author or publisher, and ZFIN has permission only to display this image to its users. Additional permissions should be obtained from the applicable author or publisher of the image. Full text @ Sci. Rep.