
- Title
-
Compressive stress gradients direct mechanoregulation of anisotropic growth in the zebrafish jaw joint
- Authors
- Godivier, J., Lawrence, E.A., Wang, M., Hammond, C.L., Nowlan, N.C.
- Source
- Full text @ PLoS Comput. Biol.

In the Meckel’s cartilage (MC) element, immobilisation had the most pronounced effects on rudiment depth. (A) Brightfield ventral view of a 7 dpf zebrafish head expressing Tg(Col2a1aBAC:mCherry) cartilage marker showing the location of the jaw joint (yellow box). (B) 3D views of the jaw in the ventral and lateral planes illustrating the anterior Meckel’s cartilage (MC) element. (C) Shape outlines of average MC shape at 4, 4.5 and 5 dpf for free-to-move (a, b) and immobilised (c, d) larvae. (D–F) MC length (D), depth (E) and width (F) measurements taken on individual larvae from the free-to-move (n = 4 per group) and immobilised larvae (n = 3 per group) at 4, 4.5 and 5 dpf. Bars indicate significant differences (p<0.05) between the free-to-move and immobilised groups at 5dpf; no statistically significant differences were found between the ages with each group, or between free-to-move and immobilised groups at 4 or 4.5 dpf. An: Anterior, CH: Ceratohyal, Dr: Dorsal, L: Lateral, M: Medial, MC: Meckel’s cartilage, P: Posterior, PQ: Palatoquadrate, V: Ventral. |

Immobilisation leads to altered growth rates, primarily along the ventrodorsal axis. Growth rates computed from tracked cells over period of interest. (A–C) Top panel: Illustration of the axes used for visualisation of growth anisotropy. Bottom panels: anteroposterior, ventrodorsal and mediolateral MC growth rates from 4–4.5 and 4.5–5 dpf for both free-to-move and immobilised larvae. Results are displayed in 3D and in one section in the lateral or ventral plane (section location shown in the 3D views). An: Anterior, Dr: Dorsal, L: Lateral, M: Medial, P: Posterior, V: Ventral. |

Mechanobiological simulations of zebrafish larval jaw joint morphogenesis from 4–4.5 dpf incorporating different biological and mechanobiological contributions. A) Biological contributions to morphogenesis in the absence of movements lead to undergrowth of MC depth and length compared to free-to-move shapes. A-i) Immobilised ventrodorsal (VD), anteroposterior (AP) & mediolateral (ML) growth rates applied to free-to-move 4 dpf shape. A-ii) Free-to-move growth rates. A-iii) Outlines of simulated morphogenesis with immobilised or free-to-move growth rates promoting growth. B) Hydrostatic stresses averaged over jaw motion when used as the mechanoregulatory stimulus fail to simulate physiological jaw joint morphogenesis. B-i) Mechanobiological growth rates with compression promoting growth. Red arrowheads point to local areas of non-physiological elevated growth rates. B-ii) Outlines of simulated morphogenesis. C) Hydrostatic stress gradients as mechanobiological stimulus offer enhanced predictions of jaw joint morphogenesis. C-i) Mechanobiological growth maps in which the biological baseline |

Compression and tension levels arising from jaw movements. A) Hydrostatic stress field averaged across one cycle of mouth opening and closure (termed “average stress”) at 4 and 4.5 dpf. Red arrowheads indicate a peak of compression at the level of the jaw joint. Results are displayed in 3D views and in one section in the mid-lateral plane. B) Hydrostatic stress fields at peak opening and peak closure showing a change from compression to tension along the ventrodorsal axis. Results are displayed in 3D views and in one section in the mid-lateral plane. Results in the mid-ventral plane are displayed in |
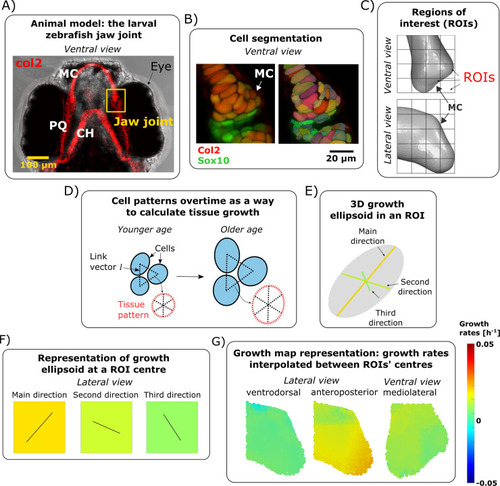
Growth rate calculations. (A) Brightfield ventral view of a 7 dpf zebrafish head expressing Tg(Col2a1aBAC:mCherry) cartilage marker showing the location of the jaw joint (yellow box). (B) Confocal ventral view of the jaw joint of a live 4.5 dpf zebrafish expressing the transgenic reporters Col2a1aBAC:mcherry (red) and -4.9sox10:eGFP (green) which mark cartilage chondrocytes. Cell segmentation result is shown on the right. (C) A grid marks out the regions (ROIs) of the anterior joint element in which growth is characterised. The length of each cube side is 15μm. (D) The position of cells with respect to each other forms a pattern. This pattern evolves over time and is used to characterise growth. (E) Computed growth is represented by an ellipsoid with orthogonal axes. The ellipsoid’s radii correspond to the growth rates and their orientation to the direction of deformation. (F) At an ROI centre, growth rate is represented by the square’s colour while the direction of growth is shown by solid black lines in the corresponding square. (G) Growth rates are interpolated between ROI centres to obtain the resulting growth maps. For simplicity, the orientation of deformation is approximated based on anatomical axes, actual orientations (as defined by the axes of growth ellipsoids) are provided in |
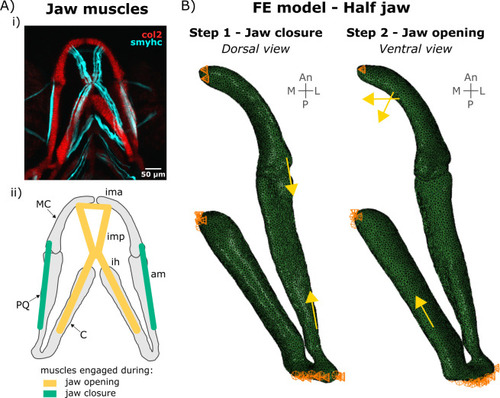
Boundary and loading conditions in the FE model. A) Lower jaw muscles. (i) Maximum projection of ventral confocal image stacks expressing Col2a1aBAC:mcherry (red) and smyhc1:EGFP (cyan) of a 4 dpf larva. (ii) Schematic of the muscles engaged during lower jaw opening (yellow) and closure (green) in the ventral plane. am: adductor mandibularis, ih: interhyal, ima: intermandibularis anterior, imp: intermandibularis posterior. B) Half jaw finite element (FE) model of jaw closure and opening with boundary conditions and muscle loads. An: Anterior, CH: ceratohyal, L: Lateral, M: Medial, MC: Meckel’s cartilage, P: Posterior. PQ: palatoquadrate. |

Process of integration of mechanical stimuli arising from movements into mechanobiological growth maps of zebrafish jaw joint morphogenesis. A) Terminology of two growth maps obtained from cell-level data: Gfree and Gimm. B) Jaw opening and closure were simulated, and the hydrostatic stress fields were extracted. C) The biological baseline Gimm was influenced by stresses arising from jaw motion either using the stress field averaged across jaw motion (method 1), or the hydrostatic stress gradients at peak jaw opening and peak closure (method 2). |