
- Title
-
Efficient detection of single nucleotide variants in targeted genomic loci
- Authors
- Sone, R., Fujimaki, S., Kawahara, A.
- Source
- Full text @ Dev. Growth Diff.
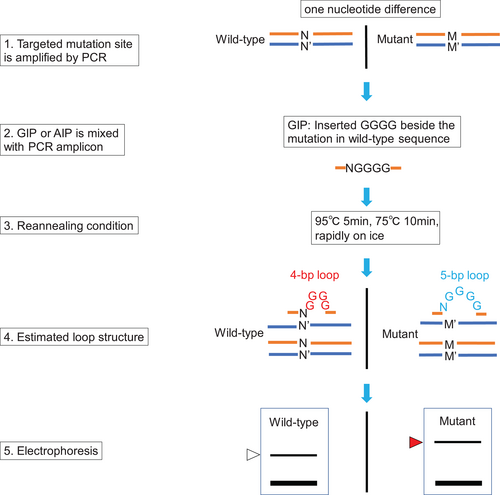
Schematic overview of the GIP-interacting mobility assay (GIMA). Genomic DNAs of the wild type and the mutant contain a single nucleotide difference (orange sense strand N, blue antisense strand N′ in the wild type; orange sense strand M, blue antisense strand M′ in the mutant). To detect the single nucleotide difference, the targeted genomic locus is amplified by PCR as described in the Materials and Methods section. The PCR amplicon is mixed with GIP or AIP and subsequently incubated under reannealing conditions in a thermal cycler. Because the GIP–wild-type complex and the GIP–mutant complex form a 4-bp loop (red) and a 5-bp loop (light blue), respectively, they are separable by electrophoresis using a polyacrylamide gel. The white arrowhead indicates the GIP–wild-type complex. The red arrowhead indicates the GIP–mutant complex. |
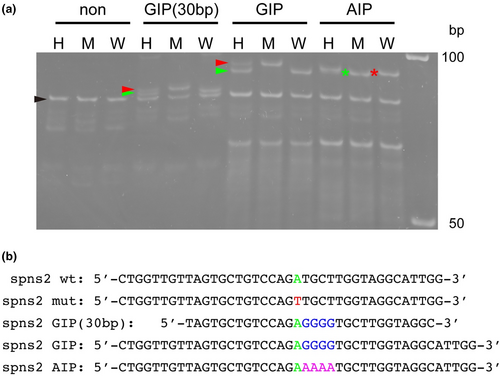
Detection of single nucleotide differences at the spns2 locus by GIMA. (a) Genotyping of the spns2 locus using GIMA. H, heterozygous alleles; M, homozygous mutant alleles; W, homozygous wild-type alleles. The black arrowhead indicates the position of the PCR amplicons (heterozygous, homozygous mutant, and homozygous wild-type bands). The red arrowheads indicate the position of the GIP–mutant or GIP (30 bp)–mutant complex. The green arrowheads indicate the position of the GIP–wild-type or GIP (30 bp)–wild-type complex. The red asterisk and green asterisk indicate the positions of the AIP–mutant and the AIP–wild-type complex, respectively. The molecular marker is indicated on the right. Essentially similar results were obtained from at least three independent experiments. (b) Nucleotide sequences of the wild-type spns2 sense strand, the mutant spns2 sense strand, GIP, and AIP are shown. Green, wild-type nucleotide site; red, mutant nucleotide site; blue, inserted guanine nucleotides; pink, inserted adenine nucleotides. |

Detection of single nucleotide differences at the slc45a2 locus by GIMA. (a) Genotyping of the slc45a2 locus using GIMA. H, heterozygous alleles; M, homozygous mutant alleles; W, homozygous wild-type alleles. The black arrowhead indicates the position of the PCR amplicons (heterozygous, homozygous mutant, and homozygous wild-type bands). The red arrowheads indicate the position of the GIP–mutant or the GIP (30 bp)–mutant complex. The green arrowheads indicate the position of the GIP–wild-type or the GIP (30 bp)–wild-type complex. The red asterisk and green asterisk indicate the positions of the AIP–mutant and AIP–wild-type complexes, respectively. The molecular marker is indicated on the right. Essentially similar results were obtained from at least three independent experiments. (b) Nucleotide sequences of the wild-type slc45a2 sense strand, the mutant slc45a2 sense strand, GIP, and AIP are shown. Green, wild-type nucleotide site; red, mutant nucleotide site; blue, inserted guanine nucleotides; pink, inserted adenine nucleotides. |