
- Title
-
Kremen1 regulates the regenerative capacity of support cells and mechanosensory hair cells in the zebrafish lateral line
- Authors
- Megerson, E., Kuehn, M., Leifer, B., Bell, J.M., Snyder, J.L., McGraw, H.F.
- Source
- Full text @ iScience
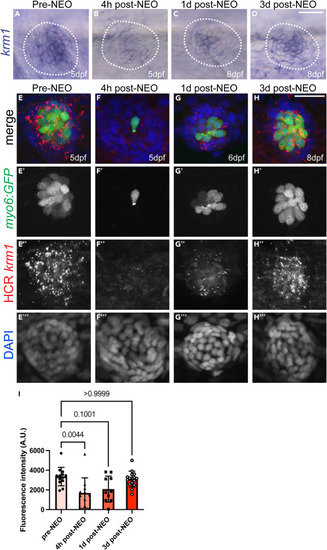
krm1 expression is dynamic during posterior lateral line regeneration (A–D) RNA in situ hybridization of krm1 showing expression in 5dpf NM prior to exposure to NEO, 4 h after NEO exposure, 1 day post NEO exposure in a 6dpf larva, and 3 -days post NEO exposure in 8dpf larva. (E–H) Confocal projections of HCR-FISH showing krm1 expression (red) during regeneration in wild-type NMs in Tg(myosin6b:GFP)w186 larvae (green) with nuclei labeled with DAPI (blue) in 5dpf NM prior to exposure to NEO, 4 h after NEO exposure, 1 day post NEO exposure in a 6dpf larva, and 3 days post NEO exposure in a 8dpf larva. (I) Quantification of fluorescence intensity in arbitrary units (A.U.) of HCR krm1 expression normalized to background during regeneration in wild-type larvae. Pre-NEO n = 13 NM (7 fish), 4 h post-NEO n = 11 NM (7 fish), 1 day post-NEO n = 10 NM (7 fish), and 3 days post-NEO n = 14 NM (9 fish). All data presented as mean ± SD, Kruskal-Wallis test, Dunn’s multiple comparisons test. Scale bar = 20 μm. |
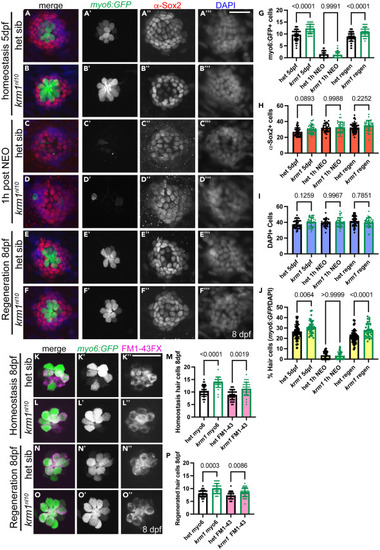
krm1nl10 larvae form supernumerary hair cells following regeneration in posterior lateral line neuromasts (A–B‴) Confocal projections of neuromasts in heterozygous sibling and krm1nl10 larvae with Tg(myosin6b:GFP)w186 expression in hair cells (green), α-Sox2 antibody-labeled support cells (red) and DAPI-labeled nuclei (blue) at 5dpf NM prior to exposure to NEO. (C–D‴) Heterozygous sibling and krm1nl10 mutant at 1 h post NEO exposure. (E–F‴) Heterozygous sibling and krm1nl10 mutant 3 days post NEO exposure. (G–J) Quantification of Tg(myosin6b:GFP)w186 positive hair cells, α-Sox2 antibody-labeled support cells at 5dpf pre-NEO exposure, and the percentage of hair cells Tg(myosin6b:GFP)w186 -positive cells/DAPI-labeled cells) at 1-h post NEO exposure, and at 8dpf, 3 days post NEO exposure.). 5dpf: het sibling n = 48 NMs (9 fish), krm1nl10 n = 38 NM (9 fish); 1h-post NEO: het sibling n = 25 NMs (7 fish), krm1nl10 n = 36 NM (7 fish); 8dpf: het sibling n = 57 NMs (11 fish), krm1nl10 n = 34 NM (10 fish). (K–L″) Confocal projections of live images showing FM1-43 incorporation (magenta) in Tg(myosin6b:GFP)w186-positive hair cells (green) at 8dpf in heterozygous sibling krm1nl10 mutant NMs under homeostatic conditions. (M) Quantification of labeled hair cells during homeostasis, heterozygous sibling n = 36 NM (9 fish), krm1nl10 n = 31 NM (10 fish). (N–O″) FM1-43 incorporation (magenta) in Tg(myosin6b:GFP)w186-positive hair cells (green) at 8dpf heterozygous sibling and krm1nl10 mutant NMs under regeneration conditions. (P) Quantification of regenerated hair cells, heterozygous sibling n = 34 NM (10 fish), krm1nl10 n = 33 NM (10 fish). All data presented as mean ± SD, Kruskal-Wallis test, Dunn’s multiple comparisons test. Scale bar = 20 μm. |
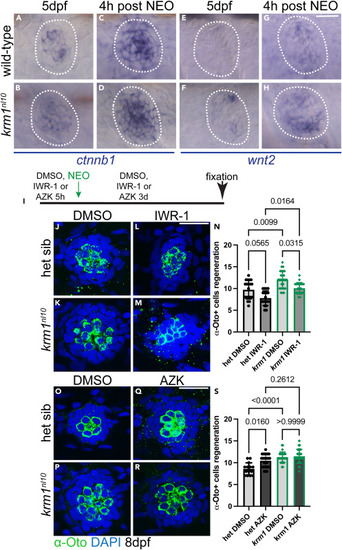
Wnt signaling is active during regeneration in krm1nl10 neuromasts (A–D) Representative images of RNA in situ hybridization at 5dpf of ctnnb1 expression in wild-type and krm1nl10 mutant NMs without exposure to NEO and 4 h post NEO exposure. (E–H) wnt2 expression in wild-type and krm1nl10 mutant NMs without exposure to NEO and 4 h post NEO exposure. Scale bar = 20 μm. (I) Timeline of DMSO or inhibitor exposure, NEO-induced hair cell ablation, and regeneration between 5dpf and 8dpf. (J–M) Confocal projects of 8dpf NMs following regeneration, hair cells are labeled with α-Otoferlin antibody (green) and nuclei are labeled with DAPI (blue) in heterozygous sibling or krm1nl10 NMs with exposure to DMSO or IWR-1. (N) Quantification of α-Otoferlin-positive cells. DMSO-exposed heterozygous sibling n = 20 NM (8 fish) and IWR-1-exposed heterozygous sibling n = 19 NM (9 fish), and DMSO-exposed) and IWR-1-exposed krm1nl10 n = 20 NM (9 fish). (O–R) Confocal projects of 8dpf NMs following regeneration, hair cells are labeled with α-Otoferlin antibody (green) and nuclei are labeled with DAPI (blue) in heterozygous sibling or krm1nl10 NMs with exposure to DMSO or AZK. (S) Quantification of α-Otoferlin-positive cells. DMSO-exposed heterozygous sibling n = 14 NM (8 fish) and DMSO-exposed krm1nl10 n = 29 NM (9 fish), and AZK-exposed heterozygous sibling n = 26 NM (11 fish) and AZK-exposed krm1nl10 n = 28 NM (9 fish). All data presented as mean ± SD, Kruskal-Wallis test, Dunn’s multiple comparisons test. Scale bar = 20 μm. See also Figure S1. |
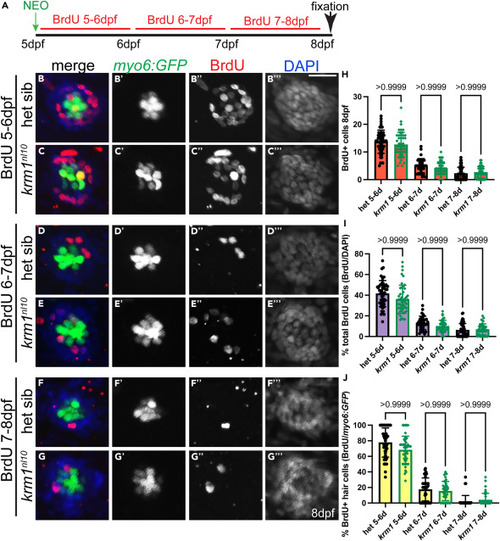
Proliferation does not contribute to the regeneration of supernumerary hair cells in krm1nl10 neuromasts (A) Timeline of neomycin expose at 5dpf, followed by 24 h of BrdU incubation at 5-6dpf, 6-7dpf, or 7-8dpf, all conditions were allowed to develop until 8dpf then fixed and processed for imaging. (B–G‴’’) Confocal projections of L2 neuromasts at 8dpf expressing Tg(myosin6b:GFP)w186 to label regenerated hair cells (myo6:GFP; green), BrdU incorporation (red), and DAPI labeling of nuclei (blue) at 5-6dpf in heterozygous sibling or krm1nl10 mutant neuromasts NMs, from 6-7dpf,or from 7-8dpf. Scale bar = 20 μm. (H–J) Total numbers of BrdU-positive cells in heterozygous or krm1nl10 mutant neuromasts, percentage of total BrdU-positive cells (total BrdU+ cells/total DAPI+ cells), and percentage of BrdU-positive hair cells (BrdU+ myo6:GFP+ cells/total myo6:GFP+ cells). 5-6dpf: het sibling n = 50 NMs (12 fish), krm1nl10 n = 46 NM (11 fish); 6-7dpf: het sibling n = 34 NMs (9 fish), krm1nl10 n = 39 NM (9 fish); 7-8dpf: het sibling n = 50 NMs (12 fish), krm1nl10 n = 40 NM (10 fish). All data presented as mean ± SD, Kruskal-Wallis test, Dunn’s multiple comparisons test. |
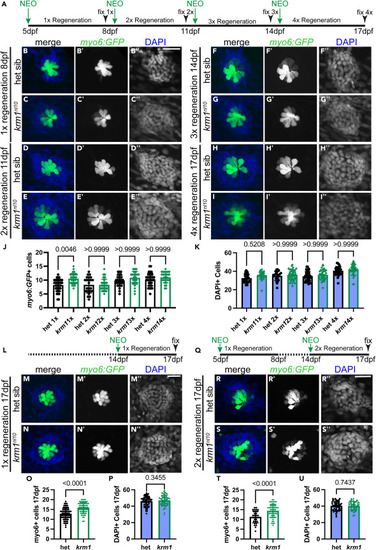
Repeated regeneration eliminates supernumerary hair cells in krm1nl10 larvae (A) Timeline of NEO exposure and repeated regeneration. (B–I″) Confocal projections of NMs expressing Tg(myosin6b:GFP)w186 in hair cells (green) and DAPI-labeling in nuclei following repeated exposures to NEO in heterozygous sibling and krm1nl10 mutant NMs at 8dpf following 1 round of NEO exposure and regeneration, at 11dpf following 2 rounds of NEO exposure and regeneration, at 14dpf following 3 rounds of NEO exposure and regeneration, and at 17dpf following 4 rounds of NEO exposure and regeneration. (J–K) Quantification of regenerated Tg(myosin6b:GFP)w186 hair cells or DAPI-labeled nuclei in heterozygous sibling and krm1nl10 mutant NMs at 8dpf, 11dpf, 14dpf, and 17dpf. 8dpf heterozygous sibling n = 38 NM (8 fish) and krm1nl10 mutant n = 30 NM (10 fish), 11dpf heterozygous sibling n = 23 (9 fish) and krm1nl10 n = 39 NM (10 fish), 14dpf heterozygous sibling n = 37 NM (9 fish) and krm1nl10 n = 31 NM (9 fish), and 17dpf heterozygous sibling n = 34 NM (10 fish) and krm1nl10 n = 31 NM (9 fish). (L) Timeline of a single round NEO-exposure and regeneration between 14 and 17dpf. (M–N″) Heterozygous sibling and krm1nl10 mutant NMs at 17dpf following 1 round of NEO exposure and regeneration. (O–P) Quantification of regenerated Tg(myosin6b:GFP)w186 hair cells and DAPI-positive cells at 17dpf. Heterozygous siblings n = 68 NM (12 fish) and krm1nl10 n = 62 NM (12 fish). (Q) Timeline of 2 rounds of NEO exposure (at 5dpf and 14dpf) and regeneration until 17dpf. (R–S″) Heterozygous sibling and krm1nl10 mutant NMs at 17dpf following 2x rounds of NEO exposure and regeneration. (T–U) Quantification of regenerated Tg(myosin6b:GFP)w186 hair cells and DAPI-positive cells at 17dpf. Heterozygous siblings n = 33 NM (8 fish) and krm1nl10 n = 58 NM (9 fish). All data presented as mean ± SD, Kruskal-Wallis test, Dunn’s multiple comparisons test. Scale bar = 20 μm. |
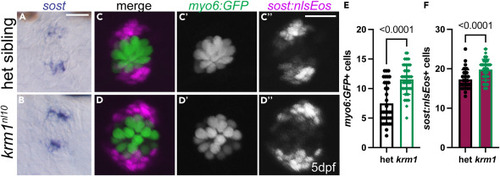
Dorsoventral support cells are increased in krm1nl10 mutant NMs (A and B) RNA in situ hybridization showing sost expression in dorsoventral cells in heterozygous sibling and krm1nl10 NMs at 5dpf. (C–D″) Confocal projections of Tg(myosin6b:GFP)w186 labeled hair cells (green) and Tg(sost:nlsEos)w215 labeled dorsoventral support cells (magenta) immediately following photoconversion in live 5dpf heterozygous sibling and krm1nl10 mutant NMs. (E–F) Quantification of Tg(myosin6b:GFP)w186 hair cells and total Tg(sost:nlsEos)w215 expressing NM cells. Heterozygous siblings n = 34 NM (8 fish) and krm1nl10 n = 46 NM (9 fish). All data presented as mean ± SD, Mann-Whitney test. Scale bar = 20 μm. See also Figure S2. |
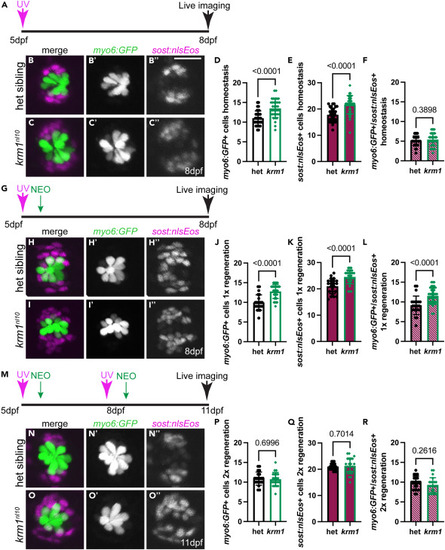
Dorsoventral support cells contribute to supernumerary hair cells following regeneration in krm1nl10 mutant NMs (A) Timeline for Tg(sost:nlsEos)w215 photoconversion at 5dpf and homeostatic development until 8dpf. (B–C″) Homeostasis at 8 days of Tg(myosin6b:GFP)w186 labeled hair cells (green) and Tg(sost:nlsEos)w215 labeled dorsoventral support cells (magenta) following photoconversion in 5dpf heterozygous sibling and krm1nl10 mutant NMs. (D–F) Quantification of Tg(myosin6b:GFP)w186 hair cells, total Tg(sost:nlsEos)w215 expressing NM cells, and hair cells expressing both Tg(myosin6b:GFP)w186 and Tg(sost:nlsEos)w215 at 8dpf. Heterozygous siblings n = 21 NM (12 fish) and krm1nl10 n = 22 NM (12 fish). (G) Timeline for Tg(sost:nlsEos)w215 photoconversion and NEO at 5dpf and 1 round of regeneration until 8dpf. (H–I″) 1 round of regeneration of Tg(myosin6b:GFP)w186 labeled hair cells (green) and Tg(sost:nlsEos)w215 labeled dorsoventral support cells (magenta) following photoconversion at 5dpf and NEO-exposure in heterozygous sibling and krm1nl10 mutant NMs. (J–L) Quantification of Tg(myosin6b:GFP)w186 hair cells, total Tg(sost:nlsEos)w215 expressing NM cells, and hair cells expressing both Tg(myosin6b:GFP)w186 and Tg(sost:nlsEos)w215 at 8dpf following 1 round of regeneration. Heterozygous siblings n = 23 NM (8 fish) and krm1nl10 n = 31 NM (8 fish). (M) Timeline for Tg(sost:nlsEos)w215 photoconversion and NEO at 5dpf and again at 8dpf, for 2 rounds of regeneration until 11dpf. (N–O″) 2 rounds of regeneration of Tg(myosin6b:GFP)w186 labeled hair cells (green) and Tg(sost:nlsEos)w215 labeled dorsoventral support cells (magenta) following photoconversion and NEO-exposure at 5dpf and 8dpf in heterozygous sibling and krm1nl10 mutant NMs. (P–R) Quantification of Tg(myosin6b:GFP)w186 hair cells, total Tg(sost:nlsEos)w215 expressing NM cells, and hair cells expressing both Tg(myosin6b:GFP)w186 and Tg(sost:nlsEos)w215 at 8dpf following 2 rounds of regeneration. Heterozygous siblings n = 21 NM (8 fish) and krm1nl10 n = 22 NM (7 fish). All data presented as mean ± SD, Mann-Whitney test. Scale bar = 20 μm. |
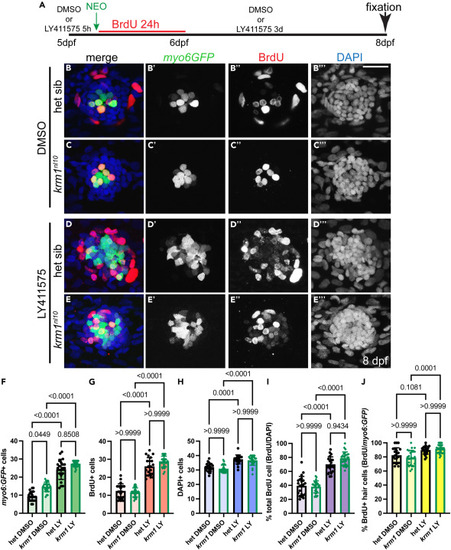
Notch signaling regulates cellular proliferation during regeneration in krm1nl10 neuromasts (A) Timeline of drug exposure between 5-8dpf. DMSO or LY411575 at 5dpf for 5-h prior to NEO exposure, NEO exposure, BrdU incubation for 24 h h in the presence of DMSO or LY411575, and then regeneration to 8dpf with exposure to DMSO or LY411575. (B–E‴) Confocal projections of L2 neuromasts at 8dpf expressing Tg(myosin6b:GFP)w186 to label regenerated hair cells (myo6:GFP green), BrdU incorporation (red), and DAPI labeling of nuclei (blue) in heterozygous sibling and krm1nl10 mutant larvae following exposure to DMSO or LY411575. (F–J) Quantification of myo6:GFP-labeled hair cells at 8dpf following regeneration during exposure to DMSO or LY411575, BrdU-labeled NM cells 8dpf following regeneration during exposure to DMSO or LY411575, percentage of BrdU-positive cells/DAPI-labeled nuclei in NMs, and percentage of myo6:GFP-labeled hair cell co-labeled with BrdU. DMSO-exposed heterozygous siblings n = 22 NM (9 fish) and krm1nl10 n = 26 NM (9 fish); LY411575-exposed heterozygous siblings n = 20 NM (11 fish) and krm1nl10 n = 26 NM (9 fish). All data presented as mean ± SD, Kruskal-Wallis test, Dunn’s multiple comparisons test. Scale bar = 20 μm. See also Figure S3. |
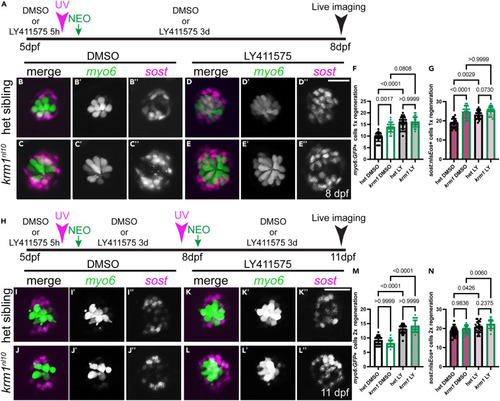
Notch signaling alters NM cell numbers following repeated damage (A) Timeline of drug exposure from 5-8dpf, photoconversion, NEO exposure, regeneration, and live imaging. (B–E″) Live confocal projections of Tg(myosin6b:GFP)w186 labeled cells (myo6, green) and Tg(sost:nlsEos)w215 labeled cells (sost, magenta) in larvae exposed to DMSO or LY411575 and 1 round of regeneration in heterozygous sibling krm1nl10 mutant larvae. (F–G) Quantification of Tg(myosin6b:GFP)w186 labeled hair cells and Tg(sost:nlsEos)w215 labeled cells at 8dpf following regeneration during exposure to DMSO or LY411575. DMSO-exposed heterozygous siblings n = 20 NM (9 fish) and krm1nl10 n = 21 NM (9 fish); LY411575-exposed heterozygous siblings n = 22 NM (9 fish) and krm1nl10 n = 25 NM (11 fish). (H) Timeline for drug exposure, Tg(sost:nlsEos)w215 photoconversion and NEO at 5dpf and again at 8dpf, for 2 rounds of regeneration until 11dpf. (I–L″) Heterozygous sibling and krm1nl10 mutant larvae exposed to DMSO or LY411575 during 2 rounds of regeneration. (M and N) Quantification of Tg(myosin6b:GFP)w186 labeled cells and Tg(sost:nlsEos)w215 labeled cells following 2 rounds of regeneration in the presence of DMSO or LY411575. DMSO-exposed heterozygous siblings n = 24 NM (11 fish) and krm1nl10 n = 23 NM (10 fish); LY411575-exposed heterozygous siblings n = 22 NM (8 fish) and krm1nl10 n = 24 NM (10 fish). All data presented as mean ± SD, Kruskal-Wallis test, Dunn’s multiple comparisons test. Scale bar = 20 μm. See also Figure S3. |