
- Title
-
Independent mesenchymal progenitor pools respectively produce and maintain osteogenic and chondrogenic cells in zebrafish
- Authors
- Komiya, H., Sato, Y., Kimura, H., Kawakami, A.
- Source
- Full text @ Dev. Growth Diff.

Generation of the zebrafish Tg(sox9a:creERt2) lines. (a) Schematic illustration of cell labeling using Cre/loxP recombination. The double Tg of the Cre-expressing line under the control of the sox9a promoter and the loxP reporter line, Tg(Olactb:loxP-bfp-loxP-egfp), was treated with 4-hydroxytamoxifen (TAM) to induce recombination at the loxP sites. (b) Recombination efficiencies in two Cre Tg lines, tyt229 and tyt230. tyt230 displayed a higher number of EGFP+ cells than tyt229. Scale bar, 50 μm. (c) Confocal images of Cre-labeled cells (left panels) and their optical sections at positions a and b (right panels). EGFP+ cells were mainly present in the somites (dotted lines). Scale bars, 50 μm. (d) Contribution of Cre-labeled cells to adult fin rays. Representative images of adult fins labeled with TAM at 0–1 days post-fertilization (dpf). Most fin rays contained EGFP+ cells in tyt230, whereas only a few fin rays contained EGFP+ cells in tyt229 (arrows). Scale bar, 500 μm. (e) Quantification of fish with EGFP+ fin rays in tyt230. For TAM treatment, 5 μM TAM was given for 2 h starting from the indicated time points, and the number of fish with fin rays containing EGFP+ cells was scored. Labeling declined during the early larval stages. (f) Typical image of a labeled fin ray in tyt230 treated with TAM at 7 dpf. Only a few fin rays in the dorsal and ventral regions were labeled. Scale bar, 500 μm. |
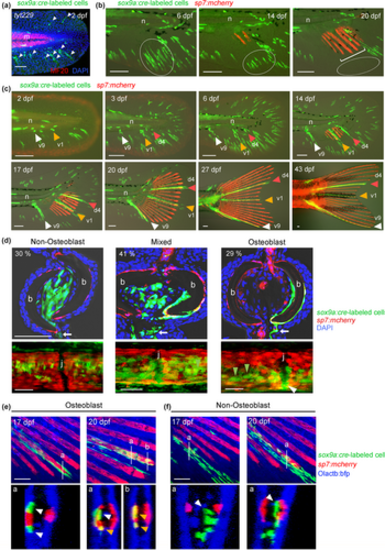
Clonal fate tracking of sox9a+ cells. (a) Confocal images of Cre-labeled EGFP+ cells in the fin fold at 2 dpf. Red fluorescence, immunostaining of myotomes (m) with the MF-20 anti-myosin antibody. The nuclei were stained with 4′,6-diamidino-2-phenylindole (DAPI). Note that the fin fold mesenchymes have a characteristic morphology (arrowheads). Scale bar, 50 μm. (b) Live cell tracking in the fin folds. Most EGFP+ cells disappeared during the larval stage (circled areas). Bracket, emerging fin ray osteoblasts (sp7:mcherry). n, notochord. Scale bars, 100 μm. (c) Time-lapse analysis of labeled cells that give rise to adult fin rays. One or a few cells located at the base of the fin fold at 2 or 3 dpf proliferated to become adult fin rays. In this example, the labeled cells give rise to v9 (white arrowheads), v1 (yellow arrowheads), and d4 (red arrowheads) rays. n, notochord. Scale bars, 100 μm. (d) Confocal images of cryosections (upper panels) and whole-mount views (lower panels) of adult fin rays with EGFP+ cells in non-osteoblast cells (left), osteoblasts (right), and both (middle) (n = 76 fin rays from 18 fish containing EGFP+ cells). Nuclei are labeled with DAPI. EGFP+ cells with non-osteoblast fates do not overlap with the osteoblast marker sp7, whereas EGFP+ cells with osteoblastic and mixed fates are distributed along the fin ray bone and express sp7. Note the presence of sp7− cells in the osteoblast-producing lineage (green arrowheads). Arrows, EGFP+ cells in the inter-ray region; b, fin ray bone; j, fin ray joints; white arrowhead, OPCs in joint. Scale bars, 50 μm. (e, f) Confocal images (top panels) and optical cross-sections (lower panels, positions are indicated as a and b) showing Cre-labeled cells and osteoblasts in Tg(sox9a:creERt2;BSG;sp7:mcherry). In (e), positions indicated with “a” at 17 and 20 dpf are approximately the same positions. Production of osteoblasts from sp7− mesenchymal progenitors is observed in the osteoblast lineage (e, yellow arrowheads), but not in the non-osteoblast lineage (f, white arrowheads). EGFP+/sp7− cells at 17 dpf (e, white arrowheads) became EGFP+/sp7+ cells at 20 dpf (e, yellow arrowheads). Scale bars, 50 μm. |
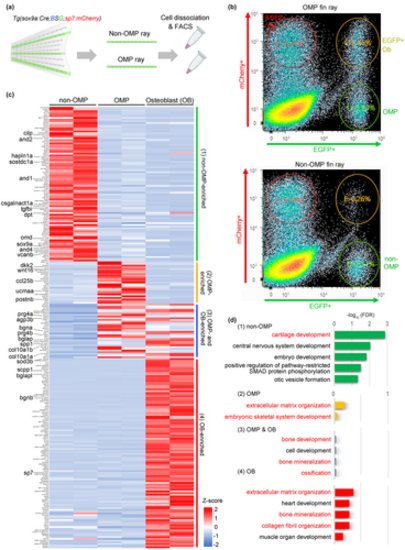
Characterization of cellular identities of osteogenic and non-osteogenic mesenchymal progenitors. (a) Schematic illustration of the experimental procedure. Cre/loxP recombination was performed at 0–1 dpf. Adult fin rays (10–20 fin rays) with respective lineage labeling were manually dissected. The dissociated cells were subjected to fluorescence-activated cell sorting to collect OMPs and non-OMPs. (b) Representative examples of cell sorting of OMPs (upper panel) and non-OMPs (lower panel). The respective plots contained 500,000 events excluding dead cells and debris. RNA was isolated from non-OMPs (green circles in the lower panel), OMPs (green circles in the upper panel), and osteoblasts (orange circles in the upper panel). (c) Cluster heatmap of normalized expression data for enriched genes in non-OMPs (91 genes), OMPs (58 genes), and osteoblasts (111 genes). Enriched genes were identified using the following parameters: TPM value (average of two independent experiments) > 10 and fold change > 5. Representative genes associated with chondroblastic and osteoblastic differentiation are indicated on the left side. OMP-enriched genes were divided into two groups, one specific to OMPs (group 2) (Table S2) and the other containing OMP/osteoblast (OB)-enriched genes (group 3) (Table S3). (d) Gene Ontology (GO) enrichment analysis of non-OMP, OMP, OMP/osteoblast, and osteoblast genes. The top five enriched GO terms in the biological process category are shown. Terms related to chondrogenic and osteogenic profiles are indicated in red. Fisher's exact test was used (p < .05). Non-OMPs apparently exhibit chondrogenic identity. |
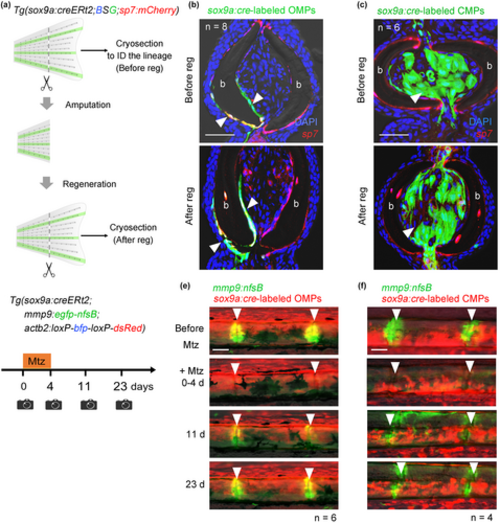
Maintenance of lineage identities during regeneration. (a) Schematic illustration of the experimental procedure. The first fin amputation was performed to inspect the lineages of EGFP+ cells in the respective fin rays. After 2 weeks, the same fin was regenerated to examine the identities of EGFP+ cells in the regenerates. (b) Sections of a fin ray containing EGFP+ OMPs (arrowheads) before and after regeneration. EGFP+ OMPs and osteoblasts (upper panel) maintain their lineage identity after fin regeneration (lower panel). n = 8. Scale bar, 25 μm. (c) Sections of a fin ray containing EGFP+ CMPs before and after regeneration. Only CMPs were generated after regeneration (arrowheads). n = 6. Scale bar, 25 μm. (d) Schematic of the experimental procedure for OPC ablation. The Tg was treated with metronidazole (Mtz) for 4 days to ablate joint OPCs and allowed to regenerate for 19 days (total 23 days). (e) Fluorescence images showing OPC replenishment from OMPs (red fluorescence). Replenished OPCs in joints look yellow. n = 6. Scale bar, 50 μm. (f) Fluorescence images of replenished OPCs in the fin ray with a CMP lineage label (red fluorescence). Replenished OPCs do not show red fluorescence. n = 4. Scale bar, 50 μm. |