FIGURE SUMMARY
Title

YTHDF2-mediated regulations bifurcate BHPF-induced programmed cell deaths

Authors
Lin, J., Zhan, G., Liu, J., Maimaitiyiming, Y., Deng, Z., Li, B., Su, K., Chen, J., Sun, S., Zheng, W., Yu, X., He, F., Cheng, X., Wang, L., Shen, B., Yao, Z., Yang, X., Zhang, J., He, W., Wu, H., Naranmandura, H., Chang, K.J., Min, J., Ma, J., Björklund, M., Xu, P.F., Wang, F., Hsu, C.H.
Source
Full text @ Natl Sci Rev

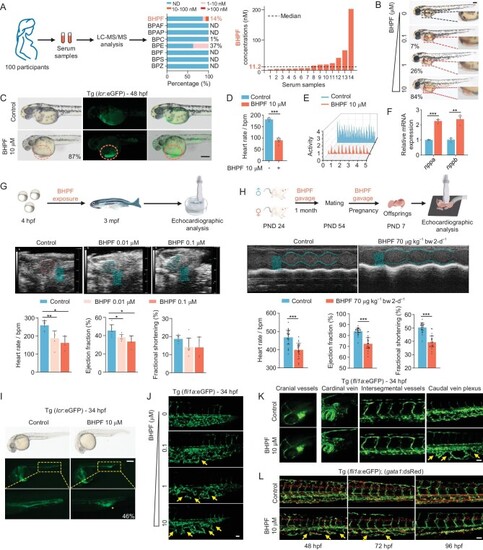
BHPF is detectable in pregnant people and displays cardiac and vascular toxicity in zebrafish and mice. A, Detection rates and concentration ranges of eight BPA substitutes in serum samples from 100 pregnant participants (left panel). Concentration of BHPF in serum samples (right panel). ND refers to not detected. B, Morphological changes of zebrafish (48 hpf) with concentration gradient exposure (0.1–10 μM) to BHPF. The pericardial condensation is indicated by red dashed boxes with percentage; n = 25–28 per group. C, Bright field and fluorescence microscopy of BHPF-exposed Tg(lcr: eGFP) zebrafish. The red dashed circles indicate pericardial condensation with percentage; n = 15–20 per group. D and E, Effects of BHPF (10 μM) on heart rate (D) and heart activity (E) of embryos. Heart rate as beats per minute (bpm) and heart activity recordings (electrocardiogram) were analyzed by DanioScope; n = 5–9 per group. F, Effects of BHPF (10 μM) exposure on mRNA expression of nppa and nppb as detected by RT-qPCR in whole embryos. G, Schematic diagram of echocardiographic analysis for BHPF-exposed zebrafish (top panel). Representative echocardiograms (middle panel), summary of heart rate (as bpm), cardiac ejection fraction (EF) and fractional shortening (FS) in control and BHPF exposed (0.01–0.1 μM for 3 months) zebrafish (bottom panel); n = 4–7 per group. H, Diagram showing the BHPF exposure and echocardiography analysis in mice (top panel). Representative echocardiograms (middle panel), summary of heart rate (as bpm), cardiac ejection fraction (EF) and fractional shortening (FS) in the offspring of control and BHPF-exposed mice (7.3 nM BHPF in the serum of pregnant mice) (bottom panel); n = 26–29 per group. I, Effects of BHPF (10 μM) on distribution of erythroid in zebrafish (34 hpf). The yellow dashed boxes and asterisk indicate blood accumulation with percentage; n = 28–30 per group. J, Confocal observation of CVP in Tg(fli1a: eGFP) zebrafish (34 hpf) with concentration gradient exposure (0.1–10 μM) to BHPF. The yellow arrows indicate CVP defects. K, Effects of BHPF (10 μM) on vein development in different regions of zebrafish (34 hpf). The yellow arrows indicate CVP defects. L, Effects of BHPF (10 μM) on vein development in different developmental stages of zebrafish (48–96 hpf). The yellow arrows indicate CVP defects. Zebrafish embryos were treated with BHPF from 4 hpf to the indicated time. Scale bar, 300 μm (B, C, I) or 20 μm (J–L). Data are mean ± s.d. Student's t test, *represents P < 0.05, **represents P < 0.01, *** represents P < 0.001.

BHPF induces cardiac ferroptosis through reduction of YTHDF2-facilitated translation of m6A-gch1. A, Changes in the number of zebrafish cardiomyocytes following concentration gradient exposure (0.1–10 μM) to BHPF. The images (left panel) were quantified as a histogram (right panel); n = 6–9 per group. B, Rescue effects of different PCD inhibitors on BHPF-induced reduction of heart rate (bpm) and number of cardiomyocytes. Chloroquine (CQ) is an autophagy inhibitor; Necrostatin-1 (Nec-1) is a necroptosis inhibitor; VX765 (Belnacasan) is a pyroptosis inhibitor; Q-VD-OPh is an apoptosis inhibitor; Ferrostatin-1 (Fer-1) is a ferroptosis inhibitor. All inhibitors were co-treated with BHPF from 4 hpf to 48 hpf; n = 6–13 per group. C, Effects of BHPF exposure on mRNA expression of ferroptosis markers ptgs2a and ptgs2b in FACS sorted zebrafish embryonic cardiomyocytes. D, Pathway enrichment analysis by SMPDB (small molecule pathway database) based on metabolomic profiling. E and F, Effects of exogenous BH2 supplementation on heart rate (bpm refers to beats per minute) (E) and heart activity (F) of BHPF exposed zebrafish; n = 12–17 per group. G, Effects of BHPF exposure on BH2 concentration and GCH1 protein levels. BH2 concentration was detected by LC-MS/MS. H and I, Rescue effects of exogenous gch1 mRNA on heart rate (H) and heart activity (I); n = 10–12 per group. J, Representative images of cardiac sections stained with Hematoxylin and eosin (HE), Sirius red or Wheat germ agglutinin (WGA) in hearts obtained from the offspring of the control and BHPF-exposed mice. Red arrows indicate inflammatory cells and blue arrows indicate collagen fibrils. K, Images of immunofluorescence for YTHDF2 and GCH1 staining, and immunohistochemistry for 4-HNE in the offspring of the control and BHPF-exposed mice with quantification. L, Measurement of gch1 mRNA translation profile in mettl3 morphants by polysome profiling. M, Effects of BHPF exposure on YTHDF2 protein levels. N, Measurement of gch1 mRNA translation profile in ythdf2 morphants by polysome profiling. O, Top panel shows the affinity between YTHDF2 and gch1-flag mRNA (wild type and m6A modification sites mutant). Bottom panels show the measurement of gch1 mRNA and protein levels in gch1-flag (WT and MUT) mRNA microinjected control embryos and ythdf2 morphants. P, Representative echocardiograms, summary of heart rate, cardiac ejection fraction (EF) and fractional shortening (FS) in wild-type (ythdf2+/+) and ythdf2 mutant (ythdf2−/−) zebrafish; n = 5–7 per group. Q, Images of immunofluorescence for GCH1 staining and immunohistochemistry for 4-HNE in wild-type (ythdf2+/+) and ythdf2 mutant (ythdf2−/−) zebrafish with quantification. R, Schematic diagram shows BHPF-mediated downregulation of YTHDF2 stimulating ferroptosis-induced cardiac injury by reduction of YTHDF2-facilitated gch1 translation. Molecular biology experiment materials are zebrafish embryonic cardiomyocytes sorted by FACS (C) or whole embryos (D, G, L–O). Zebrafish embryos were collected at 48 hpf (A–I, L–M) or 10 hpf (O). Scale bar, 50 μm (A–B) or 20 μm (J–K, Q). Data are mean ± s.d. Student's t test, ns represents P > 0.05, * represents P < 0.05, ** represents P < 0.01, *** represents P < 0.001.

BHPF-mediated downregulation of YTHDF2 induces apoptosis via activation of STING1-NFκB/UTX-TNFα axis. A and B, Effects of apoptosis inhibitor Q-VD-OPh on BHPF-induced CVP defects (A) and apoptosis (B) in 34 hpf zebrafish embryos with quantification (N denotes number of embryos for each experimental group). C, Effects of YTHDF2 depletion (ythdf2-MO) on apoptosis (images with quantification) and tnfα mRNA levels in zebrafish embryos. D, Schematic illustration of the unbiased DNA oligo affinity protein assay (DAPA)-mass spectrometry method. E, Venn diagram showing overlap of the DAPA-MS identified zebrafish tnfα promoter-bound proteins with the predicted zebrafish tnfα promoter transcription factors expressed in CVP region. The heat map depicting the abundance of proteins binding to tnfα promoter fragment with or without BHPF exposure (right panel). The data is log10 transformed. F, Western blot results showing the binding affinity of p65 to tnfα promoter fragment upon BHPF exposure (up panel) or depletion of YTHDF2 (down panel). G, ChIP-qPCR and RT-qPCR analysis showing association of p65, UTX, and H3K27me3 levels on tnfα promoter and tnfα mRNA expression in 34 hpf embryos under BHPF exposure with or without JSH-23 treatment. H, ChIP-qPCR analysis showing the levels of tnfα promoter-bound p65 and H3K27me3 in 34 hpf wild type zebrafish embryos and ythdf2 morphants. I, ChIP-qPCR and RT-qPCR analysis showing association of p65 on tnfα promoter and tnfα mRNA expression in 34 hpf embryos under BHPF exposure with or without H-151 treatment. J, Effects of m6A binding ability of YTHDF2 on YTHDF2 and sting1 mRNA interaction in embryos expressing wild type (ythdf2-flag WT) or m6A binding defective mutant (ythdf2-flag MUT); crebbp was used as a positive control. K, Effects of YTHDF2 on sting1 mRNA stability. Wild-type embryos, ythdf2 morphants with or without 8 hours of Actinomycin D (ActD) treatment were harvested for RT-qPCR analysis. L, Line chart showing the levels of microinjected sting1 mRNA (wild type and m6A modification sites mutant) in embryos at indicated time points. M, Effects of H-151, JSH-23, and GSK-J4 on BHPF-induced CVP defects with quantification (N denotes number of embryos for each experimental group). N, Schematic illustration of the YTHDF2-STING1-NFκB/UTX-TNFα apoptosis axis upon BHPF exposure. Suppression of any single step within this pathway (H-151 for STING, JSH-23 for NFκB, GSK-J4 for UTX, tnfα morpholino for TNFα, and Q-VD-OPh for apoptosis) rescued BHPF-induced CVP defects. Scale bar, 20 μm (A–C, M). Molecular biology experiment materials are zebrafish whole embryos (D–L). Zebrafish embryos were treated with BHPF from 4 hpf to the indicated time. Data are mean ± s.d. Student's t test, ns represents P > 0.05, * represents P < 0.05, ** represents P < 0.01, *** represents P < 0.001.

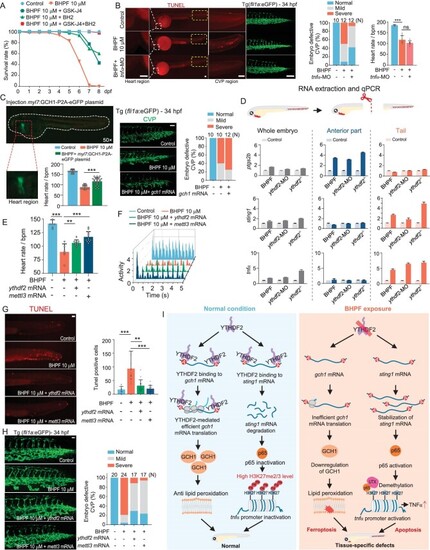
YTHDF2 acts as a bifurcation point leading to tissue-specific PCDs upon BHPF exposure. A, Survival analysis of embryos upon BHPF exposure with or without cotreatment with apoptosis and ferroptosis inhibitors; n = 45–50 per group. B, Effects of TNFα depletion (tnfα-MO) on BHPF-induced apoptosis (left panel), CVP defects (middle panel), and heart rate (right panel) in Tg(fli1a: eGFP) zebrafish embryos. C, Effects of cardiomyocyte-specific overexpression of gch1 on BHPF-induced heart rate reduction (Wild type zebrafish) and CVP defects (Tg(fli1a: eGFP) zebrafish). Red box indicates the heart region. The white dashed line indicates the trunk region. D, Schematic diagram of whole embryo, anterior, and tail parts for gene expression analysis (top panel). Expression levels of ptgs2a, sting1, and tnfα mRNA in whole embryo, fore, and tail trunks from untreated, BHPF exposed, ythdf2 knock-down (Morpholino) and ythdf2 mutant zebrafish embryos (bottom panel). E and F, Rescue effects of exogenous YTHDF2 and METTL3 on BHPF-mediated reduction of heart rate (E) and heart activity (F) as analyzed by DanioScope; n = 6–12 per group. G and H, Rescue effects of exogenous YTHDF2 and METTL3 on BHPF-mediated CVP apoptosis (G) and CVP defects (H); n = 9–17 per group (G). I, Schematic diagram illustrating the mechanism of YTHDF2-mediated tissue specific programmed cell deaths (PCDs) in embryos upon BHPF exposure. N denotes number of embryos for each experimental group. Quantification of the images on the left is shown in the right panels. Scale bar, 100 μm (B–C, G–H). BHPF treatment of zebrafish embryos from 4 hpf to the indicated time. Data are mean ± s.d. Student's t test, ns represents P > 0.05, ** represents P < 0.01, *** represents P < 0.001.

Acknowledgments
This image is the copyrighted work of the attributed author or publisher, and ZFIN has permission only to display this image to its users. Additional permissions should be obtained from the applicable author or publisher of the image. Full text @ Natl Sci Rev