FIGURE SUMMARY
Title

Cytoglobin regulates NO-dependent cilia motility and organ laterality during development

Authors
Rochon, E.R., Xue, J., Mohammed, M.S., Smith, C., Hay-Schmidt, A., DeMartino, A.W., Clark, A., Xu, Q., Lo, C.W., Tsang, M., Tejero, J., Gladwin, M.T., Corti, P.
Source
Full text @ Nat. Commun.

cygb2 mutant phenotype presents organ laterality defects.\

a CRISPR/Cas9 mediated genome editing of cygb2. Two different gRNA were targeted to exon 1 (denoted by red text) and resulted in 4 bp and 1 bp frame shift mutations (beginning in the blue shaded region of the predicted protein structure) named cygb2801a and cygb2801b, respectively. The eight globin protein helices (labeled A-H) are represented by boxes, with out-of-frame amino acids shaded blue. b Whole mount 3D confocal projections (right) of wt and cygb2pt801atg(fli1eGFPy1) hearts at 4 days post fertilization (dpf) with schematic (left) representing the heart morphology and direction of blood flow. V – ventricle, A – atrium, Y – yolk. Scale bar = 20 µm. c, d Quantification of the percentage of embryos with a left-sided heart loop in cygb2801a and cygb2801b. Means are ± SD (n = 6–7, each n representing an independent experiment consisting of 50 embryos). Student’s t test, two-tailed, **P < 0.01, ***P < 0.001. e Representative in situ hybridization images of the cygb2801a laterality phenotype. southpaw (spaw), 16 somites, dorsal view; lefty2 (lft2), 22 h post fertilization (hpf), dorsal view; myosin light chain 7 (myl7), 96 hpf, ventral view; and foxa3, 2 dpf, dorsal view. Green arrow heads indicate the liver and blue arrow heads point to the pancreas. Scale bars = 100 μm. f Quantification of the percentage of embryos with right, straight/bilateral or left sided expression of spaw, lft2, mly7 or foxa3. The total number of embryos analyzed is shown in red above the graph. The Chi-squared test was used to determine statistical significance. Source data are provided as source data file.

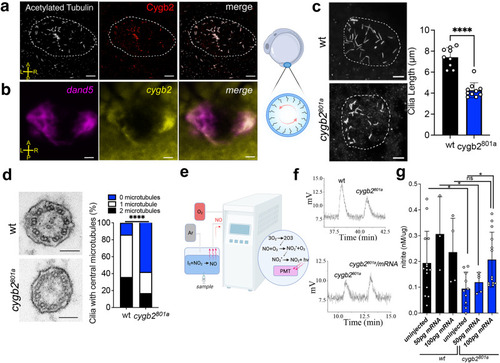
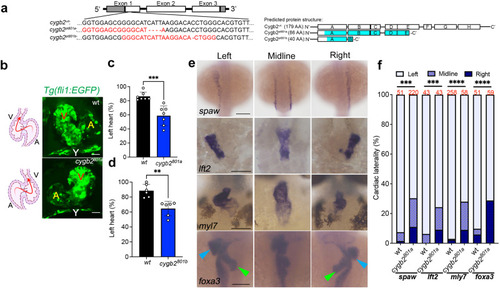
Cygb2 is expressed in cilia and through NO production regulates cilia structure.

a Kupffer’s vesicle (KV) at 8–10 somites stained with anti-acetylated tubulin (white) to visualize cilia and anti-Cygb2 (red) on whole mount embryos. The KV is outlined with a white dashed line. Scale bar = 10 μm. b Whole mount fluorescent in situ hybridization labeling dand5 (magenta) and cygb2 (yellow) transcripts using RNAscope. Image orientation: A- anterior, P- posterior, L- left, R- right. Scale bar = 10 μm. a, b show representative images of three experiments. On the right, rendering of a zebrafish embryo at 10 somites denoting the location of the KV. Panel generated with BioRender.com. c Immunostaining of KV cilia in wt and cygb2801a with anti-acetylated tubulin antibody. On the right, average cilia length. Means are ± SD (n = 9–10 embryos). Student’s t test, two-tailed, ****P < 0.0001. Scale bar = 10 μm. d Transmission electron microscopy of KV cilia comparing wt and cygb2801a. Scale bar = 100 nm. On the right, quantification of the number of central microtubules represented as the percentage of total number of cilia analyzed (n = 12–13 embryos). Chi-square test, ****P < 0.0001. e Schematic of the NO Analyzer (NOA). Panel generated with BioRender.com. f Chemiluminescence detection of NO production by triiodide assay using pools of 50 embryo (10 somites) lysates as samples comparing wt to cygb2801a(above) and uninjected cygb2801a to cygb2 mRNA injected cygb2801a (below). g Quantification of nitrite levels normalized to protein amount. Samples represent pools of embryos (n = 3–14, each n is the lysate of 50 embryos) uninjected or injected with cygb2 mRNA (50 or 100 pg). Black bars represent wt embryos and blue bars represent cygb2801a embryos. Means are ± SD. Student’s t test, two-tailed, *P < 0.05. Source data are provided as source data file.

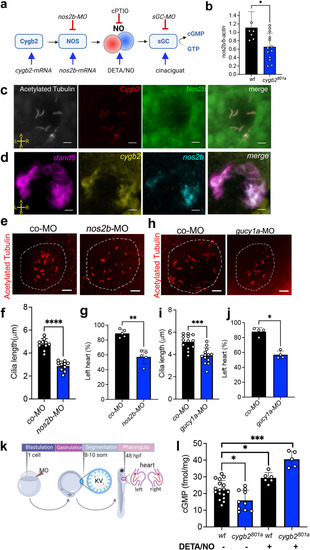
Perturbations of the NO signaling pathway phenocopy cygb2 mutants.

a Schematic of Cygb2-NO-sGC signaling outlining experimental approaches to activate and inhibit the pathway. Panel generated with BioRender.com. b mRNA expression of nos2b relative to β-actin at 8–10 somites normalized to wt expression quantified by qRT-PCR. Means are ± SD (n = 6–12, each n is the lysate of 50 embryos). c Immunostaining of acetylated tubulin (white), Cygb2 (red) and Nos2b (green) on whole mount embryos. d Whole mount fluorescence in situ hybridization labeling dand5 (pink), cygb2 (yellow) and nos2b (cyan) transcripts using RNAscope. c, d show representative images of three experiments. e, h Immunostaining of acetylated tubulin in the KV of scrambled control and nos2b or gucy1a morphants. The KV is outlined with a white dashed line. f, i Average cilia length, means are ± SD (n = 10–13 embryos). Student’s t test, two-tailed, ****P < 0.0001, ***P < 0.001. g, j Percentage of embryos with left-sided hearts in control morphants (co-MO) versus nos2b (ATG MO) and gucy1a (ATG MO) morphants, means are ± SD (n = 4–5, each n representing an independent experiment consisting of 50 embryos). Student’s t test, two-tailed, **P < 0.01, *P < 0.05. k Experimental schematic demonstrating the timing of morpholino (MO) injection, KV formation and left/right patterning phenotype. Panel generated with BioRender.com. l cGMP levels were measured by ELISA comparing wt to cygb2pt801a with and without 250 μM DETA/NO treatment. Means are ± SD (n = 5–17 independent replicates with each sample representing 50 pooled embryos at 8–10 somites). Student’s t test, two-tailed, *P < 0.05, ***P < 0.001. Image orientation: A- anterior, P- posterior, L- left, R- right. Scale bar = 10 μm. Source data are provided as source data file.

Cygb2 regulates Nos2b-NO-sGC signaling in KV cilia function and cardiac laterality determination.

a Beads were injected into the KV between 8–10 somites and velocity was measured over time. Representative bead tracks of the KV comparing wt, cygb2801a embryos, wt treated with 500 μM cPTIO and DMSO as control and cygb2801a treated with 250 μM DETA/NO and NaOH/PBS as control (n = 4 embryos per treatment). The dot indicates the end of the bead track after ten seconds of tracking. Scale bar = 20 μm. Boundaries of the KV are demarcated by a white dashed line. b Quantification of bead velocities (n = 20–35 beads over 4 embryos). Means are ± SD. One-way Anova, ***P = 0.003; ****P < 0.0001. c Analysis of cardiac laterality defects represented as a percentage of embryos with the correct heart looping (on the left) analyzed at 2 dpf. Wt and cygb801a treated with 250 µM DETA/NO or 500 μM cPTIO at the end of the blastula period. Means are ± SD, (n = 4). Student’s t test, two-tailed, ns = not significant, *P < 0.05, **P < 0.01. d Experimental schematic of the developmental time course drug treatment with 250 µM DETA/NO. Panel generated with BioRender.com. e Percentage of embryos with right, midline or left heart orientation following treatment with DETA/NO beginning at different developmental stages. The total number of embryos analyzed is shown in red above the graph. The Chi-squared test was used to determine statistical significance. f Quantification of the percentage of embryos with left hearts comparing wt to cygb2pt801a with and without treatment of 80 µM cinaciguat. Means are ± SD, (n = 4–6). Student’s t test, two-tailed, ns = not significant, ** P < 0.01. g Quantification of the percentage of embryos with left heart comparing wt to cygb2pt801a injected with nos2b mRNA compared to uninjected controls. Means are ± SD, (n = 6–7). Student’s t test, two-tailed, *P < 0.05, ns = not significant. In (c, f, g): each sample represent an independent experiment consisting of 50 embryos. Source data are provided as source data file.

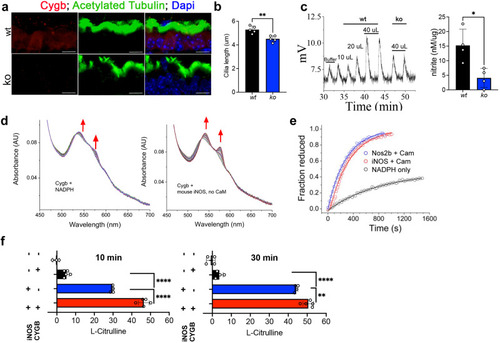
Cygb is required for NO formation through molecular interactions with iNOS.

a Immunostaining of Cygb in mouse airway epithelium visualized by immunofluorescence. Scale bar = 10 μm. b Quantification of cilia length from wt and Cygb mutant (ko) mouse (n = 4). Means are ± SD. Student’s t test, two-tailed, **P < 0.01. c Chemiluminescence detection of NO production by triiodide assays using mouse trachea lysates as samples comparing wt to ko with injection volume indicated. On the right, quantification of nitrite concentration normalized by protein amount in each tissue (n = 4). Means are ± SD. Student’s t test, two-tailed, *P < 0.05. d Reaction of 8 µM ferric CYGB in the presence of 250 µM NADPH. Increased absorbance at around 543 and 575 nm is consistent with the reduction of CYGB and formation of the CYGB Fe2+-O2 complex. On the left, the reaction with CYGB and NADPH only. On the right, the same reaction in presence of 12.5 nM mouse iNOS. e Traces indicating the reduction of ferric CYGB in the presence of different reducing systems: zebrafish Nos2b, mouse iNOS or NADPH alone. f L-Citrulline assay indicating NO production by iNOS in presence or absence of CYGB (n = 3–5). Means are ± SD. Student’s t test, two-tailed, **P < 0.01, ****P < 0.0001. Source data are provided as source data file.

Acknowledgments
This image is the copyrighted work of the attributed author or publisher, and ZFIN has permission only to display this image to its users. Additional permissions should be obtained from the applicable author or publisher of the image. Full text @ Nat. Commun.