
- Title
-
The Role of MAPRE2 and Microtubules in Maintaining Normal Ventricular Conduction
- Authors
- Chiang, D.Y., Verkerk, A.O., Victorio, R., Shneyer, B.I., van der Vaart, B., Jouni, M., Narendran, N., Kc, A., Sampognaro, J.R., Vetrano-Olsen, F., Oh, J.S., Buys, E., de Jonge, B., Shah, D.A., Kiviniemi, T., Burridge, P.W., Bezzina, C.R., Akhmanova, A., MacRae, C.A.
- Source
- Full text @ Circ. Res.

mapre2 loss of function leads to decreased ventricular conduction and voltage-gated sodium channel (NaV) function. A through C, Voltage mapping of hearts isolated from wild-type (WT) vs heterozygous (HET) and homozygous (HOMO) mapre2 knockout (KO) zebrafish. In HOMO hearts, there was a nonsignificant decrease in ventricular conduction velocity (CV; A), a significant decrease in ventricular maximum upstroke velocity of the action potential (Vmax; dV/dt; P=0.0121 vs WT; B), and a nonsignificant increase in ventricular action potential duration (APD; C). There was also a significant decrease in ventricular Vmax in HET hearts compared with WT (P=0.0363). Multiple comparisons were done using the Dunnett test if 1-way ANOVA was significant (P=0.0147 for Vmax in B). D through F, Voltage mapping of hearts isolated from control (CTL) vs mapre2 morpholino (MO)-injected larvae. In MO hearts, there was a significant decrease in ventricular CV (unpaired t test, P<0.0001; D) and Vmax (unpaired t test, P<0.0001; E) and a significant increase in ventricular APD (Mann-Whitney U test, P=0.0021; F). All hearts (represented by dots) were isolated from 5-dpf zebrafish larvae. The dotted squares in A and D reflect the main ventricular area in the hearts from which the parameters were measured. APD was measured at 80% repolarization while the hearts were paced at 100 bpm. |

mapre2 loss of function leads to conduction slowing in adult fish. Two-lead surface electrocardiogram (ECG) was performed in anesthetized fish from the mapre2 knockout (KO) line. A, Representative averaged ECG tracings demonstrating similarity to human ECG with the notable exception of the inverted T wave. B through G, In homozygous (HOMO) mapre2 KO, there is a nonsignificant increase in P-wave duration and a significant increase in QRS duration, suggesting ventricular conduction slowing, with heterozygotes showing an intermediate phenotype (1-way ANOVA, P<0.0001 followed by Tukey multiple comparisons test, P=0.0435 wild-type [WT] vs heterozygous [HET]; P=0.0314 HET vs HOMO; P<0.0001 WT vs HOMO; F). Each dot represents 1 fish. |

mapre2 loss of function leads to decreased Na+ current. A, Voltage clamp protocol used to measure sodium current (INa; top) and typical INa traces ( bottom) of a freshly isolated wild-type (WT) and knockout (KO) myocyte. As detailed in the Supplemental Material, we collected ventricles from 4 to 5 adult fish that were pooled for each cell isolation. n indicates the number of cells measured from 3 isolations. B, Average current-voltage (I-V) relationships ( left) and dot plots of INa density at −20 mV ( right) in WT and KO myocytes showing a decrease of INa density in KO myocytes. I-V relationships were compared with the 2-way repeated measures ANOVA (P=0.036) followed by pairwise comparison using the Student-Newman-Keuls test. The INa densities at −20 mV were compared using the Student t test. The numbers indicate the P values <0.05. C, The time course of current inactivation at −20 mV was fitted by a double-exponential equation: I/Imax=Af×exp(−t/τf)+As×exp(−t/τs), where Af and As are the fractions of the fast and slow inactivation components, and τf and τs are the time constants of the fast and slow inactivating components, respectively. Data did not differ significantly (Student t test). Neither the time constants nor the relative amplitudes were different between WT and KO myocytes. D, Voltage dependency of activation ( left) and V1/2 and k of the Boltzmann fits of every cell measured ( right). Solid lines are Boltzmann fits to the average data. Data did not differ significantly (Student t test). E, Voltage clamp protocol used to measure voltage dependency of INa inactivation ( top) and typical INa inactivating traces ( bottom). F, Voltage dependency of inactivation and V1/2 and k of the Boltzmann fits of all cells ( right). Solid lines are Boltzmann fits to the average data. Data did not differ significantly (Student t test). |

mapre2 loss of function leads to disruption of adherens junctions. A, Representative immunostaining of hearts from wild-type (WT) vs homozygous mapre2 knockout (KO) larvae shows a general disorganization of ventricular Ncad (N-cadherin). Representative of 2 WT vs 2 KO hearts. B, Immunocytochemistry of hearts from WT vs homozygous mapre2 KO larvae on the transgenic background with cdh2 tandem fluorescent timer (tFT). Immunostaining of ZO-1 (zonula occludens-1) was used to mark cell borders. Signal from green fluorescent protein (GFP) that takes 5 minutes to fold marks nascent Ncad, whereas signal from red fluorescent protein (RFP) that takes 100 minutes to fold marks stable Ncad. Quantification of GFP and RFP signals using the ZO-1 signal as a mask shows no significant change in nascent Ncad localization ( C) but decreased stable Ncad localization at cell borders (unpaired t tests, P=0.0020 in D and P=0.0278 in E), suggesting disruption of adherens junctions. Each dot represents 1 heart. Representative images were chosen based on closeness to group mean and image quality. |
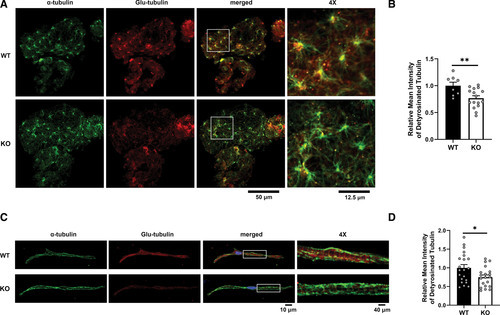
mapre2 loss of function leads to decreased detyrosinated tubulin. A, Representative immunostaining of hearts from wild-type (WT; n=8) and homozygous knockout (KO; n=16) larvae showing a decrease in ventricular detyrosinated tubulin (Glu-tubulin) relative to total α-tubulin. B, Quantification of ventricular Glu-tubulin signal using α-tubulin signal as a mask (unpaired t test, P=0.0072). C, Representative immunostaining of ventricular myocytes isolated from adult WT (21 cells from 2 fish) and homozygous KO fish (20 cells from 3 fish) also showing a decrease in ventricular detyrosinated tubulin (Glu-tubulin) relative to total α-tubulin. D, Quantification of ventricular Glu-tubulin signal using α-tubulin signal as a mask (unpaired t test, P=0.0232). Representative images were chosen based on closeness to group mean and image quality. |

mapre2 loss of function leads to changes in microtubule dynamics. A, Representative still images of microtubule plus-end-tracking experiments in induced pluripotent stem cell derived cardiomyocytes (iPSC-CMs) with MAPRE2 knockdown (KD) using 2 different siRNA vs control siRNA. Scale bars, 10 µm. Please refer to the Supplemental Material for representative videos (Video S1, control; Video S2, siRNA 1; and Video S3, siRNA 2). B, Representative kymographs obtained from the live-cell imaging, which were used for measurement of microtubule parameters. Vertical scale bars, 10 s; horizontal scale bars, 5 µm. Compared with control, MAPRE2 knockdown with siRNAs 1 and 2 resulted in 1.11-fold (P=0.0079) and 1.26-fold (P<0.0001) increases in microtubule growth velocity ( C and D) and in 1.22-fold (P<0.0001) and 1.34-fold (P<0.0001) increases in microtubule growth distance ( E and F), respectively. Dunn multiple comparison tests were used following significant Kruskal-Wallis tests (P<0.0001 for both D and F). Data extracted from 368 control microtubules, 314 siRNA 1 microtubules, and 194 siRNA 2 microtubules, in 5 sets of cells. Representative videos and images were chosen based on closeness to group mean and quality. |
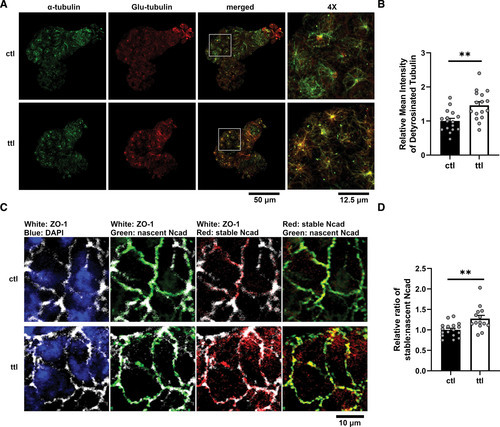
Knockdown of ttl restores fraction of detyrosinated tubulin and stable-to-nascent Ncad (N-cadherin) in mapre2 knockout (KO) hearts. A, Representative immunostaining of hearts from homozygous mapre2 KO larvae injected with control (ctl) vs ttl morpholinos showing a restoration of ventricular detyrosinated tubulin (Glu-tubulin) signal relative to total α-tubulin signal. B, Quantification of ventricular Glu-tubulin signal using α-tubulin signal as a mask (unpaired t test, P=0.0017). C, Immunocytochemistry of hearts from homozygous mapre2 KO larvae on the transgenic background with cdh2 tandem fluorescent timer (tFT). Immunostaining of ZO-1 (zonula occludens-1) was used to mark cell borders. D, Quantification of green fluorescent protein (GFP) and red fluorescent protein (RFP) signals using the ZO-1 signal as mask shows a significant increase in stable-to-nascent Ncad localization at cell borders (unpaired t test, P=0.0028), suggesting a restoration of Ncad balance at adherens junctions. Representative images were chosen based on closeness to group mean and image quality. Each dot represents 1 heart. |

Knockdown of ttl restores ventricular conduction in mapre2 knockout (KO) hearts. Voltage mapping of hearts isolated from homozygous mapre2 KO larvae injected with control (ctl) vs ttl morpholinos (MOs). ttl knockdown resulted in a significant increase of ventricular conduction velocity (CV; Mann-Whitney U test, P=0.0177; A) and maximum upstroke velocity of the action potential (Vmax; dV/dt; unpaired t test, P<0.0001; B), as well as a significant decrease in ventricular action potential duration (APD; unpaired t test, P=0.0401; C). All hearts (represented by dots) were isolated from 5-dpf zebrafish larvae. The dotted squares in A reflect the main ventricular area from which the parameters were measured. APD was measured at 80% repolarization while the hearts were paced at 100 bpm. |