FIGURE SUMMARY
Title

Genome-wide association study meta-analysis of dizygotic twinning illuminates genetic regulation of female fecundity

Authors
Mbarek, H., Gordon, S.D., Duffy, D.L., Hubers, N., Mortlock, S., Beck, J.J., Hottenga, J.J., Pool, R., Dolan, C.V., Actkins, K.V., Gerring, Z.F., Van Dongen, J., Ehli, E.A., Iacono, W.G., Mcgue, M., Chasman, D.I., Gallagher, C.S., Schilit, S.L.P., Morton, C.C., Paré, G., Willemsen, G., Whiteman, D.C., Olsen, C.M., Derom, C., Vlietinck, R., Gudbjartsson, D., Cannon-Albright, L., Krapohl, E., Plomin, R., Magnusson, P.K.E., Pedersen, N.L., Hysi, P., Mangino, M., Spector, T.D., Palviainen, T., Milaneschi, Y., Penninnx, B.W., Campos, A.I., Ong, K.K., Perry, J.R.B., Lambalk, C.B., Kaprio, J., Ólafsson, Í., Duroure, K., Revenu, C., Rentería, M.E., Yengo, L., Davis, L., Derks, E.M., Medland, S.E., Stefansson, H., Stefansson, K., Del Bene, F., Reversade, B., Montgomery, G.W., Boomsma, D.I., Martin, N.G.
Source
Full text @ Hum. Reprod.

Association results of the genome wide association study (GWAS) meta-analysis of dizygotic (DZ) twinning versus controls. (A) Manhattan plot of single nucleotide polymorphisms (SNP) associations. The -log10 p value (y-axis) for the SNPs are plotted against their physical chromosomal position (x-axis). The dashed red line represents the genome-wide level of significance (P value< 5 × 10⁻⁸). The rs numbers and gene name indicate the chromosomal region attaining genome-wide significance. For plotting purposes, overlapping data points are not drawn for filtered SNPs with a P-value ≥1 × 10⁻⁵. (B) Manhattan plot of gene-based association results as computed by MAGMA. The -log10P value (y-axis) for the genes are plotted against their physical chromosomal position (x-axis). Input SNPs were mapped to 19171 protein coding genes. Genome-wide significance (red dashed line in the plot) was defined at P = 0.05/19171 = 2.61 × 10⁻⁶.

Regional association plots for genome wide association study (GWAS) meta-analysis, for newly-reported associations. Regional association plots for the four new regions reported in Table 2. The reference single nucleotide polymorphism (SNP) is the most highly associated one reported. The suggested gene in the text is highlighted in red. Loci are: (a) 16q24.2; (b) 8p21.2; (c) 12p11.21; (d) 2p16.3. Approximate conditional analysis in GCTA on lead SNPs (not shown) shows only one significant association in each case. Plots were prepared using a stand-alone copy of LocusZoom 1.3 (http://locuszoom.org/) for the 1000G Release 3 European LD reference, and hg19/Build 37.

Genetic relationships between the genome wide association study (GWAS) meta-analysis results of dizygotic (DZ) twinning and 28 other traits. Single nucleotide polymorphism (SNP)-based genetic correlations (rg) were estimated with linkage disequilibrium (LD) score regression. The bars represent the standard error of rg. The genetic correlation estimates are colour-coded by trait category. BMI, body mass index; SHBG, sex hormone binding globulin; HDL, high-density lipoprotein; ECG, electrocardiogram; ADHD, attention deficit hyperactivity disorder.

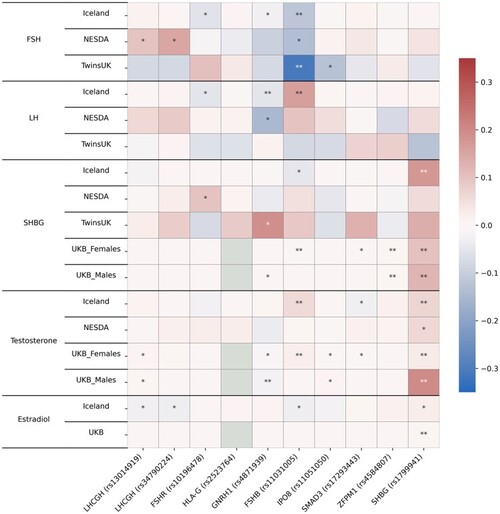
Association of top dizygotic (DZ) twinning single nucleotide polymorphisms (SNPs) with in vivo reproductive hormone data from four independent studies. Heat map showing the beta value of the association of each DZ twinning SNP and corresponding hormone data supplied by the indicated study. SNPs with a positive effect (positive beta) are shown in red, SNPs with a negative effect (negative beta) are shown in blue. Darker shading indicates beta values of larger magnitude. A single asterisk (*) indicates nominal significance at alpha = 0.05, and the double asterisk (**) indicates significance at the alpha corrected for multiple testing, i.e. alpha = 0.05/(10 × 17). Cells in light gray represent missing/unavailable data. Additional details, including study sample sizes and hormone measurement specifications, can be found in Supplementary Table S12. LHCGH, luteinizing hormone/choriogonadotropin hormone; FSHR, follicle stimulating hormone receptor; HLA-G, human leukocyte antigen G; GNRH1, gonadotropin releasing hormone 1; FSHB, follicle stimulating hormone subunit beta; IPO8, importin 8; SMAD3, mothers against decapentaplegic homolog 3; ZFPM1, zinc finger protein; FOG, Family Member 1; SHBG, sex hormone binding globulin; FSH, follicle stimulating hormone; LH, luteinizing hormone; Test, total testosterone; Est, estradiol. Iceland (deCODE), NESDA, TwinsUK and UKB are the four studies.

The correlation between population twinning rates from 53 populations and predicted dizygotic twin (DZT) polygenic risk score (PRS) for each population based on European effect sizes of top single nucleotide polymorphisms (SNPs) from Table 2. The twinning rate data are derived from Smits & Monden Demographic and Health Surveys (Smits and Monden, 2011). The HGDP group twinning rates are taken as those of the country from which they derive (e.g. Mandinka from Senegal); we have added twinning rate data for UK and Japan from Imaizumi (Imaizumi, 2003), other European twinning rates from Heino et al. (2016) and rates for Australia from the Australian Bureau of Statistics, 2010. The SNPs and their effect sizes are the 26 (unique) top associated SNPs from our genome wide association meta-analysis (GWAMA) listed in Table 2, excluding (for technical reasons) rs17293443, rs16050687, and rs17293443. Allele frequencies were obtained from the Human Genome Diversity Project and the 1000 Genomes Projects. We calculated the Pearson correlation and a bootstrap standard error (R boot package, 1000 replicates) using country-level rate and mean PRS for 53 populations. The vertical dotted line is the mean PRS for all mothers of DZ twins in the current study. The oblique line shows the regression line of observed twinning rate on the predicted DZT PRS for each population.

ipo8 deficiency in zebrafish compromises maternal, but not paternal, fertility. (A) Representative wild type (left) and maternal zygotic ipo8 knockout (right) zebrafish embryo at 2.5 hpf. Embryos devoid of ipo8 show a less compact dome with loosened blastomeres, as indicated by the black arrows. Scale bar 250 µm. (B) At the 64-cell stage, prior the onset of zygotic transcription, endogenous ipo8 mRNA, revealed by whole-mount in situ hybridization, is contributed through maternal deposition in the egg and is absent in embryos derived from homozygous ipo8 knockout females. Scale bar 250 µm. (C) Endogenous ipo8 mRNA present in the 64-cell stage, measured by QPCR, originates from the maternal, but not paternal, contribution. (D) The size of clutches laid by wildtype, heterozygous or homozygous ipo8 knockout mothers is not statistically different. Paternal ipo8 genotype has no effect on egg clutch size. N > 6 for each cross. (E) Survival of embryos at 24 h post fertilization is solely dependent on maternal, but not paternal, presence of wild type ipo8. All error bars show 95% confidence interval. ∗∗P = <0.01, ∗∗∗P = <0.001; Mann–Whitney test.

Acknowledgments
This image is the copyrighted work of the attributed author or publisher, and ZFIN has permission only to display this image to its users. Additional permissions should be obtained from the applicable author or publisher of the image. Full text @ Hum. Reprod.