
- Title
-
DanioCTC: Analysis of Circulating Tumor Cells from Metastatic Breast Cancer Patients in Zebrafish Xenografts
- Authors
- Reinhardt, F., Coen, L., Rivandi, M., Franken, A., Setyono, E.S.A., Lindenberg, T., Eberhardt, J., Fehm, T., Niederacher, D., Knopf, F., Neubauer, H.
- Source
- Full text @ Cancers

DanioCTC Workflow. A MBC patient undergoes diagnostic leukapheresis (DLA). CTCs are enriched from a DLA aliquot with the Parsortix system and isolated by FACS after staining. Cells are further stained by CellTracker Red for tracking in zebrafish embryos. Single CTCs are isolated by using the CellCelector and injected into 2 dpf old Tg( |

Capillaries. Self-prepared capillary for standard zebrafish embryo injections with a long taper narrowing and an opening diameter of approximately 25 µm. The CellCelector capillary tapers quickly, is rather short and has an opening diameter of 20 µm. |

Adapted CellCelector setup. Representative images of the CellCelector picking area of picking a single CellTracker Red-stained CTC and the attached stereomicroscope required for CTC injections in the deposit area of the CellCelector. (1) CellCelector cell picking area and image of region of interest before and after cell picking. (2) CellCelector deposit/zebrafish injection area and brightfield image of embryo being injected. |

Dissemination of MDA-MB-231 cells after injection with the standard workflow into zebrafish larvae. Depicted are the absolute MDA-MB-231 cell numbers in the head, trunk and tail at 1 and 3 dpi (n = 6). dpi: days post injection. ANOVA followed by post hoc Bonferroni test, *** 0.0001 < |
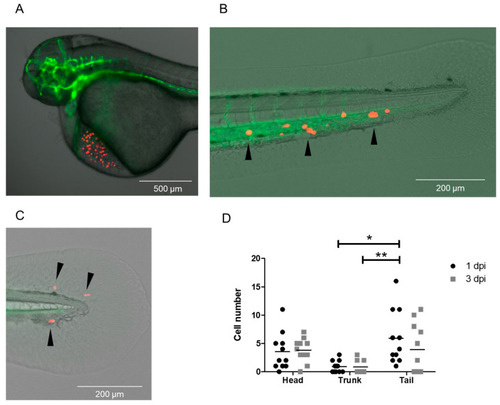
Dissemination of MDA-MB-231 cells spiked into a DLA sample after injection with the DanioCTC workflow. Cell localization was monitored at 1 and 3 dpi. ( |
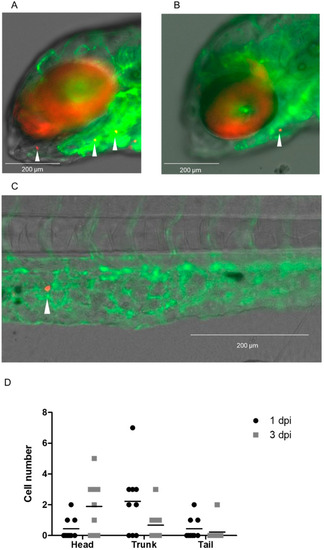
Dissemination of isolated CTCs of a MBC patient after injection with the DanioCTC workflow. Isolated CTCs, labeled in red, were monitored at 1 and 3 dpi and showed dissemination into the head, trunk and the tail. ( |