
- Title
-
Establishing Riboglow-FLIM to visualize noncoding RNAs inside live zebrafish embryos
- Authors
- Sarfraz, N., Lee, H.J., Rice, M.K., Moscoso, E., Shafik, L.K., Glasgow, E., Ranjit, S., Lambeck, B.J., Braselmann, E.
- Source
- Full text @ Biophys Rep (N Y)

Visualizing RNAs live with Riboglow-FLIM-Cy5. (A) Cobalamin (Cbl) is synthetically linked to Cy5, quenches its fluorescence, binds an RNA ligand (called the “A-tag” throughout), and alters its fluorescence lifetime. The RNA tag is genetically fused to an RNA of interest. Fluorescence lifetime decay data are fit by multiexponential reconvolution for a defined region of interest (ROI), yielding component and average lifetime (both are amplitude-weighted lifetimes, see methods for details). Both can be illustrated by a false-color scale. The "component lifetime" (v) resolves the lifetime pixel-by-pixel, while the "average lifetime" (vi, vii) provides one lifetime value per ROI. (B) Riboglow-FLIM-Cy5 in live cells (4 independent experiments, 44 cells, 1 symbol = 1 cell). One-way ANOVA (95% confidence limit); post hoc test (Tukey HSD), p-value listed (∗∗∗∗p ≤ 0.0001). Error bars: mean and standard deviation (±SD). (C) Representative cells from (B), component lifetimes displayed. Scale bars, 10 μm. (D) Phasor plot showing graphical representation of lifetime coordinates G and S for all data shown in (B). Light blue circle, untransfected cells; pink circle, transfected cells producing 1/8-NORAD(4A), 4 independent experiments, 44 cells. Phasor representative images shown in Fig. S2 D. |
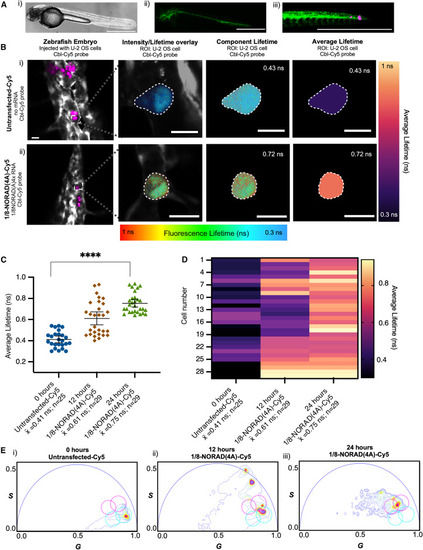
Quantitative assessment of Riboglow-FLIM-Cy5 in live zebrafish embryos. (A) Live transgenic zebrafish embryos producing GFP in embryo vasculature were injected with live U-2 OS cells. (i) Bright-field image: (ii and iii) fluorescence images: green, GFP (vascular); purple, Cy5 from Cbl-Cy5. Cells either remained (i) untransfected or were (ii) previously transfected with a plasmid producing 1/8-NORAD(4A) RNA and loaded with Cbl-Cy5. Scale bars, 750 μm. (B) Representative cells that were injected into zebrafish embryos are shown. Untransfected (top) and transfected (bottom), both loaded with Cbl-Cy5. The fluorescence lifetime image overlaid with the intensity image shows zebrafish physiology in gray (from the GFP signal of transgenic embryos). The “component lifetime” illustrates fluorescence lifetime pixel-by-pixel, rainbow color scale. The “average lifetime” is illustrated by a heatmap color scale. (C) Average lifetimes of 1/8-NORAD(4A) tagged with Riboglow-FLIM-Cy5, injected into zebrafish embryos. Fluorescence lifetime was measured at 0, 12, and 24 h post-transfection. One dot = one whole cell in the context of a zebrafish embryo. Average fluorescence lifetime for 12 independent experiments, 83 cells; 1 symbol = 1 cell. One-way ANOVA (95% confidence limit); post hoc test (Tukey HSD), p value listed (∗∗∗∗p ≤ 0.0001). Error bars = mean and standard deviation (±SD). Scale bar, 10 μm. (D) Heatmap representation of data in (C) where each average lifetime data point was assigned to a color in the heatmap. (E) Phasor plot showing graphical representation of lifetime coordinates G and S for all the data shown in (C). Light blue circle, reference for untransfected cells; pink circle, reference for transfected cells producing 1/8-NORAD(4A), 12 independent experiments, 83 cells. Phasor representative images shown in Fig. S4 B. Note that, at the 12 h time point, the GFP lifetime readout from the GFP produced in zebrafish embryo vasculature used as an internal control (see methods) was present. The lifetime from GFP creates two secondary phasor distributions on longer lifetimes and appear at longer phase angles. |