- Title
-
Systematic analysis of proximal midgut- and anorectal-originating contractions in larval zebrafish using event feature detection and supervised machine learning algorithms
- Authors
- Cassidy, R.M., Flores, E.M., Trinh Nguyen, A.K., Cheruvu, S.S., Uribe, R.A., Krachler, A.M., Odem, M.A.
- Source
- Full text @ Neurogastroenterol. Motil.
|
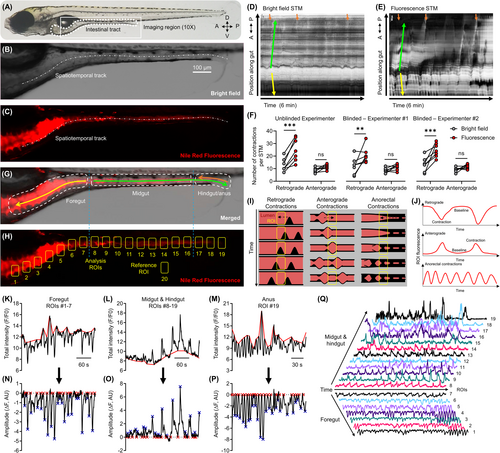
Manual and automated annotation of fluorescence contrasted contractions in larval zebrafish. (A) Wild-type AB zebrafish larvae at 7?8 dpf. The gut is outlined (dotted white line) and the region used to acquire image time series is outlined (solid white line, 10× objective). Anterior/posterior (A/P) and dorsal/ventral (D/V) axis shown. Bright field (B) and fluorescence (C) images of the gut of a 7 dpf larva following immersion in E3 with Nile Red. The dashed and dotted white line in B?C shows the spatiotemporal track drawn in the CellSens program to generate the bright field (D) and fluorescence (E) STMs for the same larva. Arrows in D?E annotate proximal midgut-originating retrograde (yellow; pRC) and anterograde (green; pAC) contractions propagating through the gut over time. Orange arrows in E annotate anorectal-originating retrograde contractions (aRC), orange arrows in D correspond to the same location. A/P axis shown for the position along the gut. (F) Paired comparisons of the number of pRC and pAC counted in the STMs for bright field and fluorescence image time series by three independent experimenters. Sample size = 7 larvae, 1 bright field, and 1 fluorescence STM per larva. Results from each experimenter were analyzed independently (refer to Table 1 for ANOVA results). **p < 0.01, ***p < 0.001. (G) Merged image with the different functional segments of the gut outlined and labeled. Directionality of pRC (yellow arrow), pAC (green arrow), and aRC (orange arrow) labeled. (H) Positioning of the analysis (#1?19) and reference (#20) ROIs used to extract fluorescence intensity time series. (I) Spatiotemporal propagation of pRC in the foregut (left), pAC in the midgut/hindgut (middle), and aRC (right) in relation to the ROIs, and (J) the resulting pattern of fluorescence intensity fluctuations in each ROI. Example FIBSI workflow for detection of pRC in the foregut (K, N), pAC in the midgut/hindgut (L, O), and aRC (M, P). Depending on the directionality of the fluorescence fluctuations, FIBSI constructed a peak-to-peak or trough-to-trough reference (red line; K, L, M) from a sliding median (not shown). That reference was then normalized to y = 0 and the resulting residuals were used for event detection (N, O, P). Event peaks (blue X) were identified only for the waveforms with start/end times where y = 0 (red X). (Q) Example gut motility patterns taken from fluorescence intensity series in ROIs 1?19 and represented on a normalized scale. |
|
Experimental design for testing reserpine effect on gut motility and datasets used to train and validate multiple logistic regression models. (A) Experimental timeline. (B) Left: Example fluorescence STM and superimposed matched events detected by FIBSI (red ticks). Right: Contraction frequencies measured per ROI (ground truth). Results represent the mean ± 95% CI. Refer to Table 2 for ANOVA and post hoc test results. *p < 0.05 for reserpine versus DMSO comparisons, #p < 0.05 for untreated versus DMSO comparisons. (C) Example fluorescence STMs. Absence of pRCs (blue arrows), absence of contraction-mediated dye transit (red arrows), and increased occurrence of non-propagating contractions (green arrows, green box at first arrow) labeled in STMs of reserpine-treated larvae. (D) Random sorting of larvae by group into training (60%) and validation (40%) datasets. (E) Outputs of FIBSI for each event in the training dataset used as prediction variables for multiple logistic regression models. |
|
Testing performance of multiple logistic regression models using the training dataset. (A, D) ROC curves for the foregut and midgut models. (B, E) Confusion matrix scores for probability classification cutoffs of 0.05?0.95. The cutoffs at which the Youden's J |
|
Testing performance of multiple logistic regression models using the validation dataset. (A, D) ROC curves for the foregut and midgut models. (B, E) Confusion matrix scores for probability classification cutoffs of 0.05?0.95. Peak cutoffs for the Youden's J |
|
Measuring anorectal-originating retrograde contractions in unfed and fed larvae. (A) Relative frequencies (%) of event durations detected by FIBSI in ROI #19 (refer to Figure 1H) of unfed and fed larvae. Minimum detectable duration was 2 s. Results represent the mean ± SD. (B) aRC frequencies (Hz) measured after excluding events with duration >10 s (gray box in A). Results represent the median with interquartile range; Mann Whitney U-test, p = 0.3355, U statistic = 388.5. (C) Wild-type AB zebrafish larvae at 7?8 dpf with the imaging region over the distal midgut and hindgut regions (solid white line, 20× objective). Anterior/posterior (A/P) and dorsal/ventral (D/V) axis shown. (D) Example fluorescence STM with pAC (green arrows), aRC (orange arrows), and ROI (solid yellow box). (E) Bright field, fluorescence, and merged image series corresponding to the selected period in the fluorescence STM in D (period marked by dotted black lines). Corresponding spatiotemporal track (dotted white line), ROI, frame numbers (1 frame = 0.565 s), and excretion event (red star, frames 115?117) labeled. (F) Isolation of the aRCs in the ROI from D by FIBSI. (G) Power spectral densities corresponding to the two signals in F and their coherence. (H) Relative frequencies (%) of event durations in unfed and fed larvae imaged using 20× objective. Events were detected by FIBSI from selected ROIs that spatially corresponded to the aRCs (1 ROI per larva). Minimum detectable duration in each dataset was 2 s. Results represent the mean ± SD. (I) aRC frequencies (Hz) measured after excluding events with duration >10 s (gray box in H). Results represent the median with interquartile range; Mann Whitney U-test, p = 0.1167, U statistic = 110.5. |


