
- Title
-
Plasticity of cone photoreceptors in adult zebrafish revealed by thyroid hormone exposure
- Authors
- Farre, A.A., Thomas, P., Huang, J., Poulsen, R.A., Owusu Poku, E., Stenkamp, D.L.
- Source
- Full text @ Sci. Rep.

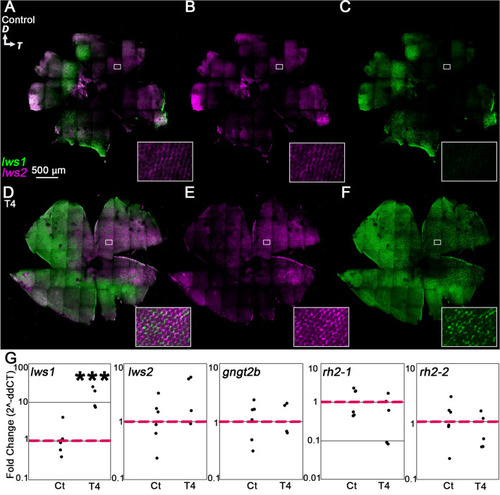
Topography of |

Plasticity of cone transcripts in response to 5 days of T4 treatment. ( |

Plasticity of cone transcripts in response to 24-h T4 treatment. ( |
Plasticity of cone transcripts in response to 12-h T4 treatment. ( |

Plasticity of cone transcripts in response to 7-h T4 treatment. ( |

Five day T4 treatment of adult zebrafish alters skin pigmentation. ( |