FIGURE SUMMARY
Title

Loss of dlx5a/dlx6a Locus Alters Non-Canonical Wnt Signaling and Meckel's Cartilage Morphology

Authors
Yu, E.P.Y., Saxena, V., Perin, S., Ekker, M.
Source
Full text @ Biomolecules

Histological analysis of dlx mutants using alcian blue and alizarin red showing altered lengths of MC, PQ and CH cartilage structures at 5 dpf. (AG) Histology stains were performed in at least 15 larvae for each genotype and presented in the ventral (AG) or lateral (A′G′) Scale = 150 μm. (HK) Flat mount images in ventral position of dlx5a−/− (n = 5) and dlx5i6−/− (n = 5). Scale = 100 μm. (L) Schematic showing how structures were measured. Lengths of both halves of MC (red), PQ (yellow) and CH (orange) were measured, then averaged for each animal. Averages were then calculated per genotype. The length (l) and width (w) of the MC were also measured. Dashed line represents entire head length. (MO) Average lengths of MC (M), PQ (N) and CH (O) in WT (n = 33), dlx1a−/− (n = 12), dlx2a−/− (n = 14), dlx5a−/− (n = 8), dlx5i6−/− (n = 13), dlx6a−/− (n = 17) and inter56−/− (n = 16) larvae. Results are reported as mean ± SEM. (P) l/w ratio in dlx5a−/− and dlx5i6−/− larvae were smaller compared to WT. One-way ANOVA with Tukey’s multiple comparisons test was performed. * p < 0.05; ** p < 0.001; *** p < 0.0001.

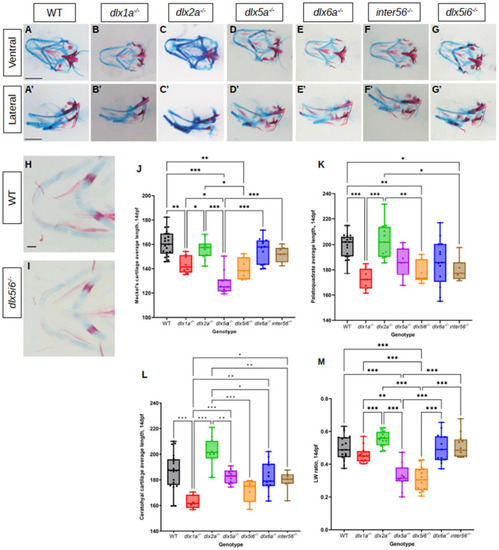
Alcian blue and alizarin red staining of 14 dpf dlx mutants reveal altered lengths of craniofacial structures. (AG) Histology stains were performed in at least 10 larvae for each genotype. Images were taken in ventral (AG) and lateral (A′G′) positions. Scale = 150 μm. (H,I) Flat mount of dlx5i6−/− (n = 5) and WT siblings (n = 6) in the ventral position to better show MC structure. Scale = 100 μm. (JL) Average lengths of MC (J), PQ (K) and CH (L) in 14 dpf animals were obtained following the same method as 5 dpf. At least 8 animals per genotype were measured. Results are reported as mean ± SEM. (M) l/w ratio in dlx5a−/− and dlx5i6−/− larvae continue to be smaller compared to WT. One-way ANOVA with Tukey’s multiple comparisons test was performed. * p < 0.05; ** p < 0.001; *** p < 0.0001.

NCC specification and migration does not appear to be affected in dlx5i6−/− embryos. (AD) Expression of NCC specifier foxd3 by WISH at 9 hpf (A,B) during NCC specification and at 14 hpf, during NCC migration (C,D). (E,F) Immunohistochemistry for Sox10 (green) at 16 hpf in WT (n = 5, (E)) and dlx5i6−/− (n = 4, (F)) show similar number of cells leaving the neural tube (dashed line). ‘h’ represents the location of head. (G) Average number of Sox10+ cells from second somite to head in a single side of each larvae. Scale = 100 μm.

Proliferation is increased in dlx5i6 mutants at 56 hpf and 5 dpf without changes in cell death. (A,B) Larvae were stained with acridine orange to label apoptotic cells (arrows) at 55 hpf. WT (n = 6, (A)) larvae had few labelled cells as was the case in dlx5i6−/− larvae (n = 7, (B)) in the pharyngeal arches. Mutants had more labelled cells in other parts of the head. (CF) BrdU staining in 56 hpf (C,D) and 5 dpf (E,F) larvae. Mutants (n = 7 for each timepoint; (D,F)) had overall more BrdU labelled cells compared to WT siblings (n = 6 at 56 hpf, n = 7 at 5 dpf; (C,E)). (E′,F′) 2× zoom of 5 dpf larvae in area within dashed line box. Arrowheads indicate double-labelled cells. (G) Quantification of BrdU+ cells in the MC at 56 hpf (left) and at 5 dpf (right). * p < 0.05, unpaired t-test. Scale = 100 μm.

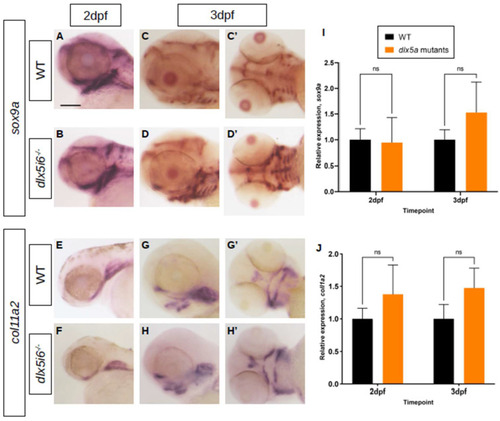
Expression of chondrocyte markers at 3 dpf in dlx5i6−/− larvae. (AD) WISH for sox9a at 2 dpf (A,B) in WT and dlx5i6−/− larvae in the lateral position. (C,D) WISH for sox9a at 3 dpf in WT and dlx5i6−/− larvae in lateral (C,D) and ventral (C′,D′) positions, showing more staining for this marker in dlx5i6−/− mutants. (E,F) WISH for col11a2 in 2 dpf WT (E) and dlx5i6−/− larvae (F) in lateral position. (G,H) WISH for col11a2 in 3 dpf WT (G,G′) and mutant (H,H′) in lateral and ventral positions. Scale = 100 μm. (I,J) Relative normalized expression of sox9a (I) and col11a2 (J) at 2 dpf (p = 0.32; p = 0.16, respectively) and 3 dpf (p = 0.42; p = 0.24, respectively). ‘ns’: not significant.

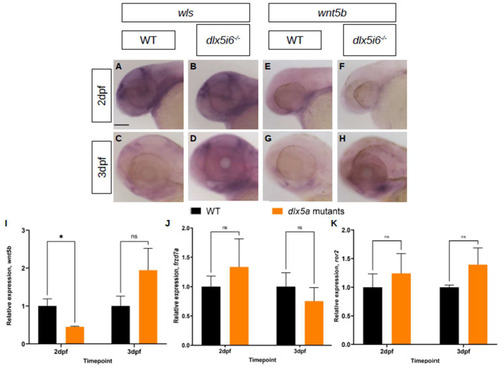
Expression of non-canonical Wnt signaling components are altered in dlx5i6−/− larvae during MC morphogenesis. (A–D) Expression of wls at 2 dpf (A,B) and 3 dpf (C,D) by WISH. (E–H) Expression of wnt5b at 2 dpf (E,F) and 3 dpf (G,H) by WISH. Scale = 100 μm. (I–K) Normalized relative expression of wnt5b (I), frzd7a (J) and ror2 (K) by RT-qPCR using at least 4 pools of head cDNA. All data presented as mean ± SEM. * p < 0.05, ns = no significance (wnt5b at 3 dpf: p = 0.21; frzd7a at 2 dpf and 3 dpf: p = 0.07, p = 0.28, respectively; ror2 at 2 dpf and 3 dpf: p = 0.13, p = 0.08, respectively).

Decreased LW ratio of MC and mispositioning of microtubule organizing center (MTOC) in dlx5i6−/− larvae. (AC) Histology stains were revisited to calculate the length and width of MC in 5 dpf (B) and 14 dpf (C) dlx5i6−/− larvae as an indicator of abnormal planar cell polarity. The length of half the MC was measured from the proximal to distal tip (A). Three width measurements were made and averaged to account for potential differences along the arch. (D,E) Larvae at 3 dpf were stained with phalloidin (red) and acetylated tubulin (green) to label cell membranes and MTOC, respectively, in WT (D) and dlx5i6 mutants (E). (D′,E′) Traces of MC cells were made to enable easier analysis. (F) A cell was divided into five regions relative to the MC midline and the position of MTOC was assigned to each region (left schematic). MTOC location should be skewed equally to the left and right positions; however, mutants displayed more randomization with greater number of MTOC in the bottom and center locations. A total of 4 WT and 4 dlx5i6−/− larvae were analyzed, representing 55 cells for each genotype. * p < 0.05.

Acknowledgments
This image is the copyrighted work of the attributed author or publisher, and ZFIN has permission only to display this image to its users. Additional permissions should be obtained from the applicable author or publisher of the image. Full text @ Biomolecules