FIGURE SUMMARY
Title

Zebrafish gonad mutant models reveal neuroendocrine mechanisms of brain sexual dimorphism and male mating behaviors of different brain regions

Authors
Dai, X., Pradhan, A., Liu, J., Liu, R., Zhai, G., Zhou, L., Dai, J., Shao, F., Yuan, Z., Wang, Z., Yin, Z.
Source
Full text @ Biol Sex Differ

Courtship parameters of wild-type male, tdrd12−/−, cyp17a1.−/− and double knockout (KO) fish with wild-type females. Twelve individuals of each genotype were selected and randomly paired with wild-type females, and all pairs were exposed to light for 20 min before the mating partition was removed. A Frequency of intimate contact with wild-type females during the courtship period. B Duration of intimate contact time with females during the courtship period. C Average frequency of intimate contact with females per minute during the courtship period. D Average duration of intimate contact time with females per minute during the courtship period. E Representative mating behaviors of males of four genotypes with wild-type females. *Significant difference (P < 0.05); **significant difference (P < 0.01); ***significant difference P < 0.001

Identification of secondary sex characteristics (SSCs). AD SSCs of wild-type females: body shape/body color (A), anal fin and anal papilla (B), caudal fin (C) and pectoral fin (D) without breeding tubercles. EH SSCs of wild-type males: body shape/color (E), anal fin (F), caudal fin (G) and pectoral fin (H). The arrow indicates a large number of breeding tubercles, which occur specifically in males. HK SSCs of cyp17a1+/+; tdrd12−/−: body shape/body color (H), anal fin (I), caudal fin (J) and pectoral fin (K) with breeding tubercles. LO SSCs of cyp17a1−/−: body shape/body color (L), anal fin (M), caudal fin (N) and pectoral fin (O) without breeding tubercles. PS SSCs of double KO mutants: body shape/body color (P), anal fin (Q), caudal fin (R) and pectoral fin (S) without breeding tubercles. mpf: months post-fertilization; PF: pectoral fin; AF: anal fin; CF: caudal fin. 6 individuals of each genotype were detected in this assay

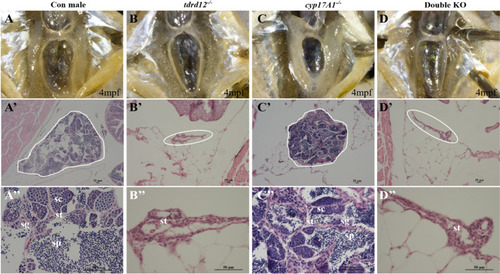
Morphology of primary sex characteristics (PSCs) of the mutants. AA″) Normal testis of a control male. Anatomical view (A); histological view of the whole testis (A′, testis outlined in white); enlarged view shows a well-developed testis with various developmental stages of germ cells, such as spermatocytes (SC), spermatogonia (SG), sperm (SP) and somatic cells (ST) in the testis (A″). BB″ Atrophic testis of a tdrd12−/− fish; the testis lacks germ cells and is surrounded by fatty layers. Anatomical view (B), histological view (B′, outlined in white) and enlarged view (B″). CC″ Testis of a cyp17a1−/− fish. Anatomical view; C histological view (C′, testis outlined in white); enlarged view shows the testis with various developmental stages of germ cells, such as SC, SG, sperm and some ST (C″). DD″ Atrophic testis of a double knockout (KO) fish. Anatomical view (D); histological view (D′, testis outlined in white); enlarged view (D″) shows an atrophic testis similar to that of the tdrd12−/− fish. 6 fish of each genotype were used in this assay

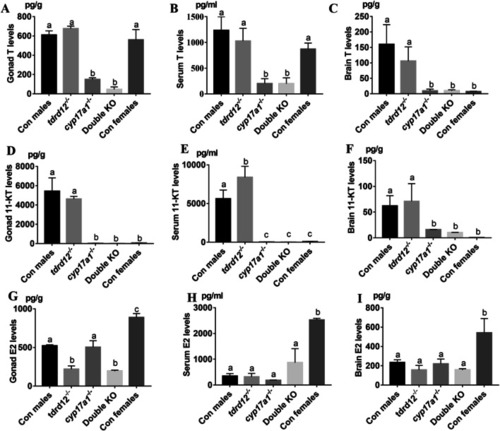
Hormone concentrations of testosterone (T), 11-ketotestosterone (11-KT) and 17β-estradiol (E2) in the gonads, serum, and brain of control males, tdrd12−/− fish, cyp17a1.−/− fish, double knockout (KO) fish and control females. AC T levels in the gonads, blood, and brain samples. DF 11-KT levels in the gonads, blood, and brain samples. C E2 levels in the gonads, blood, and brain samples. For this assay, the numbers of gonadal, blood, and brain samples were n = 4, n = 6 and n = 8; Error bars represent the mean ± SEM. Bars with different letters are significantly different from each other, P < 0.05

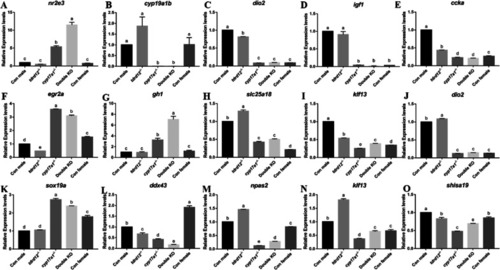
RT‒qPCR was performed to validate the RNA transcriptome data in different brain region samples. AD nr2e3, dio2, cyp19a1b, and igf1 in the forebrain; EH egr2b, gh1, slc25a18, klf3, and dio2 in the midbrain; IL sox19a, ddx43, npas2, klf3, and shisa19 in the hindbrain. Error bars represent the mean ± SD; bars with different letters are significantly different from each other, P < 0.05. Brain samples were n = 5 in biological triplicates

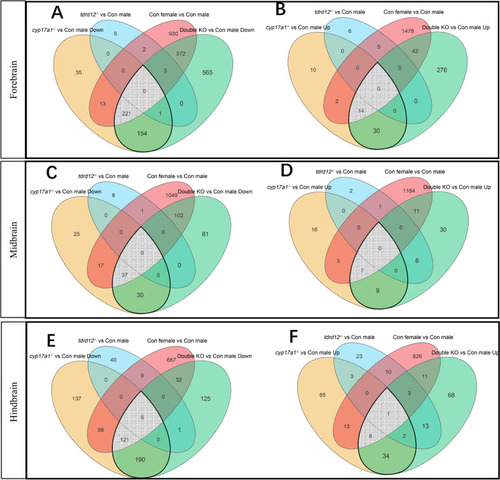
Venn diagram for significantly differentially expressed genes (DEGs) in tdrd12−/− fish, cyp17a1−/− fish, double knockout (KO), and wild-type female fish compared with wild-type males in the forebrain (A, B), midbrain (C, D), and hindbrain (E, F) (P < 0.05, |fold change|> 2). The drop-shaped regions with thick black outlines shows those shared genes are shown in in cyp17a1−/− and double KO fish compared with wild-type male brains; grey gridline areas shows those co-DEGs shared by cyp17a1−/−, double KO fish, and females compared with wild-type male brains

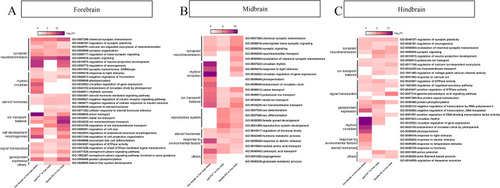
Heatmap shows the top Gene Ontology (GO) terms of male-biased genes, differentially expressed genes (DEGs) in cyp17a1.−/− fish, and DEGs in double knockout (KO) fish in comparison with wild-type males in the forebrain (A), midbrain (B) and hindbrain (C)

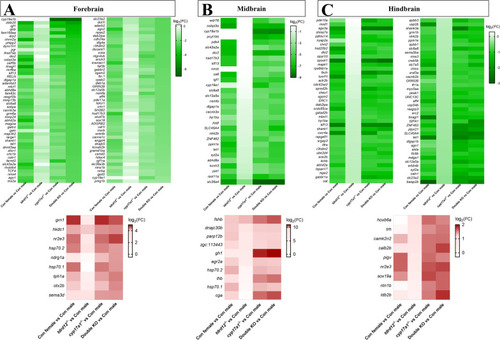
Heat map shows the representative co-downregulated (upper) and co-upregulated (down) gene expression in wild-type females, tdrd12−/− fish, cyp17a1.−/− fish or double KO fish when compared with wild-type males in the forebrain (A), midbrain (B) and hindbrain (C)

Acknowledgments
This image is the copyrighted work of the attributed author or publisher, and ZFIN has permission only to display this image to its users. Additional permissions should be obtained from the applicable author or publisher of the image. Full text @ Biol Sex Differ