
- Title
-
Influence of two anti-tumor drugs, pazopanib, and axitinib, on the development and thyroid-axis of zebrafish (Danio rerio) embryos/larvae
- Authors
- Yang, L., Tu, P.H., Zhang, C.X., Xie, R.R., Dong, M., Jing, Y., Chen, X., Wei, G., Song, H.D.
- Source
- Full text @ Front Endocrinol (Lausanne)

Developmental toxicities and survival of zebrafish embryos following exposure to different concentrations (0, 10, 50, 100 nM) of pazopanib and axitinib for 96 (h) |

Levels of T3, T4, and TSH in zebrafish embryos following exposure to different concentrations (0, 10, 50, 100 nM) of pazopanib and axitinib for 96 h. |
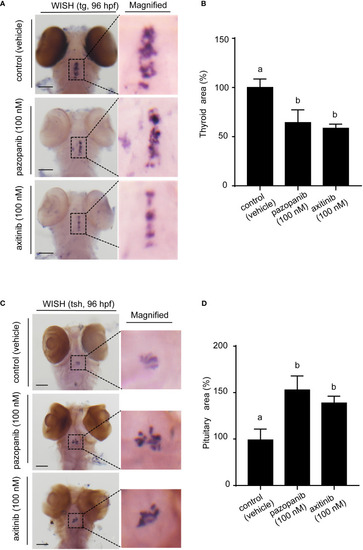
Whole-mount |

Morphology and histopathology of the thyroid in zebrafish embryos following exposure to 100 nM of pazopanib and axitinib for 96 h |

Relative expression of hypothalamic–pituitary–thyroid (HPT) axis related genes in zebrafish embryos following exposure to different concentrations (0, 10, 50, 100 nM) of pazopanib and axitinib for 96 h. |

Influence of two tyrosine kinase inhibitors on development and the thyroid system in zebrafish embryos. Pazopanib and axitinib were found to have notable toxic effects on the development and survival of zebrafish embryos, which is closely associated with disordered thyroid function. This figure was modified using Figdraw and PowerPoint. |