FIGURE SUMMARY
Title

Bmp8a deletion leads to obesity through regulation of lipid metabolism and adipocyte differentiation

Authors
Zhong, S., Chen, L., Li, X., Wang, X., Ji, G., Sun, C., Liu, Z.
Source
Full text @ Commun Biol

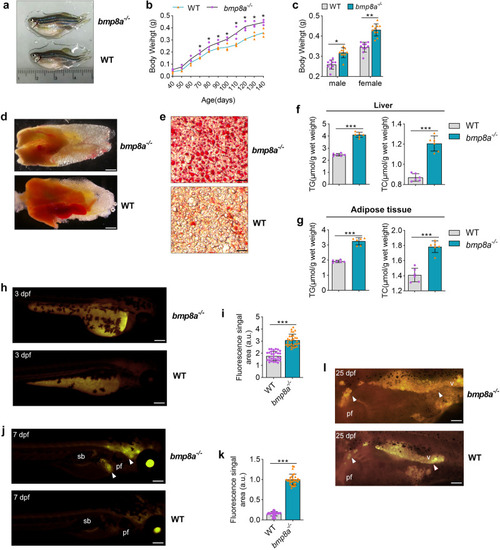
Obesogenic phenotype of bmp8a-/- zebrafish.]

a Representative photograph of WT and bmp8a-/- zebrafish (n = 10). b Body weight changes of WT and bmp8a-/- zebrafish (n = 30). c WT and bmp8a-/- (male or female) zebrafish body weight at 140 days (n = 10). d Representative photographs of WT and bmp8a-/- zebrafish visceral mass (n = 6). Scale bars = 1 mm. e Fatty liver changes were revealed by histopathological sections (n = 6). Scale bars = 20 μm. f, g The TG and TC level in WT and bmp8a-/- zebrafish (f, n = 6) or adipose tissue (g, n = 6). hk Representative photographs WT and bmp8a-/- zebrafish at 3 dpf (h, i, n = 30) or 7dpf (j, k, n = 30) were stained with Nile Red. Scale bars = 300 μm. The fluorescence signal area was calculated by ImageJ software. l Representative Nile Red staining images of WT and bmp8a-/- zebrafish at 25 dpf (n = 10). Scale bars = 300 μm. Swim bladder (sb), pectoral fin (pf), viscera (v). Data were representative of at least three independent experiments. Data were analyzed by two-tailed Student’s t-test and presented as mean ± SD (*p < 0.05, **p < 0.01, ***p < 0.001).

Bmp8a promotes fatty acid oxidation through AMPK and p38 MAPK pathways.

a The serum TG, TC and GLU level in WT and bmp8a-/- zebrafish (n = 6). b, c The qPCR analysis of genes related to fatty acid metabolism in the WT and bmp8a-/- zebrafish liver (b, n = 3) or adipose tissue (c, n = 3). d, e The bssl1 (d) and bssl2 (e) gene expression analysis in different zebrafish tissues (n = 3). f, g The qPCR analysis of bssl1 and bssl2 mRNA level in the liver (f, n = 3) and intestine (g, n = 3) from WT or bmp8a-/- zebrafish. hj Validation and quantification of p-AMPK, p-ACC, Ucp1, and Pgc-1α expression in adipose tissue (i) and liver (j) from WT or bmp8a-/- zebrafish. Protein expression levels were quantified using ImageJ software and normalized to total protein or β-actin (n = 3). km Validation and quantification of p-p38 MAPK, p-AMPK, p-ACC, Ucp1, and Pgc-1α expression after overexpression of zebrafish bmp8a in ZFL cells. The cells were collected at 36 h (I) and 48 h (m) post-transfection for Immunoblot analysis. Protein expression levels were quantified using ImageJ software and normalized to total protein or β-actin (n = 3). n Schematic overview. Data were representative of at least three independent experiments. Data were analyzed by two-tailed Student’s t-test and presented as mean ± SD (**p < 0.01, ***p < 0.001).

Stably overexpressing zebrafish bmp8a or mouse Bmp8a inhibits adipogenesis.

a Protocol for effective differentiation of 3T3-L1 cells into adipocytes. b The mRNA expression pattern of mouse Bmp8a, Pparγ and C/ebpα during 3T3-L1 cells differentiated into adipocytes (n = 3). c, d Immunoblot analysis of mouse BMP8A protein expression in 3T3-L1 cells (Mock), stably overexpressed empty plasmid in 3T3-L1 cells (LV-ZsGreen1), stably overexpressed mouse Bmp8a in 3T3-L1 cells (LV-Bmp8a), 3T3-L1 cells infected with scramble shRNA lentivirus (LV-shRNA-scrambled), and knockdown mouse Bmp8a in 3T3-L1 cells (shRNA-Bmp8a#1 and shRNA-Bmp8a#2). BMP8A protein expression levels were quantified by ImageJ software and normalized to the amount of β-actin (d,n = 3). e, f After induction of adipogenic differentiation, differentiated 3T3-L1 adipocytes (Mock, LV-ZsGreen1, LV-bmp8a, and LV-Bmp8a) were stained with Oil Red O and subjected to OD492 quantifications (n = 3). Scale bar = 20 µm. gj On the day after induction as indicated, expressions of adipogenic genes (Cebpα, Pparγ, and Fasn) were examined at the mRNA level by qPCR (n = 3). km On the day after induction, as indicated, the protein levels of PPARγ and C/EBPα detected by Immunoblot. Protein expression levels were quantified using ImageJ software and normalized to the amount of β-actin (l, m, n = 3). Data were representative of at least three independent experiments. Data were analyzed by One-way ANOVA and presented as mean ± SD (**p < 0.01, ***p < 0.001).

Knockdown Bmp8a promotes adipogenesis.

a, b After induction of adipogenic differentiation, Bmp8a knocked-down 3T3-L1 cells (LV-shRNA-Bmp8a#1) and control cells (Mock and LV-shRNA-scrambled) were stained with Oil Red O and subjected to OD492 quantifications (n = 3). Scale bar = 20 µm. cf On the day after induction as indicated, expressions of adipogenic markers (Cebpα, Pparγ, and Fasn) were examined at the mRNA levels by qPCR (n = 3). gi On the day after induction as indicated, the protein levels of PPARγ and C/EBPα were detected by Immunoblot (g). Protein expression levels were quantified using ImageJ software and normalized to the amount of β-actin (h, i, n = 3). Data were representative of at least three independent experiments. Data were analyzed by One-way ANOVA and presented as mean ± SD (**p < 0.01, ***p < 0.001).

Bmp8a activates Smad2/3 signaling to inhibit adipocyte differentiation in 3T3-L1 cells.

ad Representative western blot analysis and quantification of changes in p-Smad1/5/8, p-Smad2/3, p-ERK1/2, p-p38 MAPK, and p-JNK expression in LV-bmp8a cells (a, b) or LV-Bmp8a cells (c, d). Protein expression levels were quantified using ImageJ software and normalized to the amount of total protein (n = 3). e, f Representative Oil Red O staining photographs of LV-bmp8a and LV-Bmp8a 3T3-L1 cells were induced to adipogenic in the presence of DMH1 or TP0427736 HCL, dimethylsulfoxide (DMSO) as a vehicle and subjected to OD492 quantifications (n = 3). Scale bar = 20 µm. g Schematic diagram of BMP8 mediated signal transduction. BMP8 can activate Smad1/5/8 signal transduction through the receptor complex formed by type I receptor ALK2, ALK3, or ALK6 and type II receptor ACVR2A or BMPR2. Meanwhile, BMP8 can also activate Smad2/3 signal transduction through the receptor complex formed by type I receptors ALK4 or ALK5 and type II receptors ACVR2A, ACVR2B, or TGFBR2. h Non-expression of mouse Alk6 gene in 3T3-L1 cells (n = 3). i The qPCR quantification of the type I receptor (Alk2, Alk3, Alk4, Alk5, Alk7) and type II receptor (Acvr2a, Acvr2b, Bmpr2, Tgrβr2) transcripts expressed in 3T3-L1 cells (n = 3). j, k Quantification of the activity of BRE-driven luciferase reporters with pCMV-bmp8a (j) or pCMV-Bmp8a (k) cotransfected with pCMV-Alk2, pCMV-Alk3, pCMV-Bmpr2, pCMV-Acrv2a, respectively (n = 3). Renilla luciferase was used as the internal control. l, m Quantification of the activity of CAGA-driven luciferase reporters with pCMV-bmp8a (l) or pCMV-Bmp8a (m) cotransfected with pCMV-Alk2, pCMV-Alk3, pCMV-Bmpr2, and pCMV-Acrv2a, respectively (n = 3). Renilla luciferase was used as the internal control. Data were representative of at least three independent experiments. Data were analyzed by One-way ANOVA and presented as mean ± SD (ns not significant, *p < 0.05, **p < 0.01, ***p < 0.001).

Bmp8a activates Smad2/3 signaling to inhibit adipogenesis through type I receptor ALK4.

a Schematic drawing of wild-type and GS motif mutation (Alk3-ΔGS, Alk4-ΔGS, Alk5-ΔGS) plasmids. b, c Immunoblot analysis and quantification of p-Smad1/5/8 in Mock, LV-ZsGreen1, LV-bmp8a, LV-bmp8a + Alk3-ΔGS, LV-Bmp8a, and LV-Bmp8a + Alk3-ΔGS 3T3-L1 cells (n = 3). d, e Immunoblot analysis and quantification of p-Smad1/5/8 in Mock, LV-ZsGreen1, LV-bmp8a, LV-bmp8a + Alk4-ΔGS, LV-Bmp8a, and LV-Bmp8a + Alk4-ΔGS 3T3-L1 cells (n = 3). f, g Immunoblot analysis of p-Smad1/5/8 in Mock, LV-ZsGreen1, LV-bmp8a, LV-bmp8a + Alk5-ΔGS, LV-Bmp8a, and LV-Bmp8a + Alk5-ΔGS 3T3-L1 cells (n = 3). Protein expression levels were quantified by using ImageJ software and normalized to the amount of total protein. h, i knocked-down ALK3, ALK4, and ALK5 in LV-bmp8a or LV-Bmp8a 3T3-L1 cells, were induced to differentiate. Lipid contents of the resulting adipocyte-like cells were stained and quantified (n = 3). j Schematic diagram of the Pparγ promoter region. Three predicted TF binding sites and sequences. k Schematic drawing of wild-type and predicted TF binding sites mutation plasmids (pGL3-Pparγ-promoter-ΔR1, pGL3-Pparγ-promoter-ΔR2, pGL3-Pparγ-promoter-ΔR3). l Dual-luciferase report assay was used to analyze the abilities of zebrafish bmp8a and mouse Bmp8a in activation of the Pparγ promoter (n = 3). The pGL3-Pparγ-promoter, pGL3-Pparγ -promoter-ΔR1, pGL3-Pparγ-promoter-ΔR2 or pGL3-Pparγ-promoter-ΔR3 was transfected into HEK293T cells along with pCMV-bmp8a, pCMV- Bmp8a or empty vector. After 48 h, the transfected cells were collected for luciferase assays. Renilla luciferase was used as the internal control. Data were from three independent experiments and were analyzed by One-way ANOVA and were presented as mean ± SD (ns not significant, **p < 0.01, ***p < 0.001).

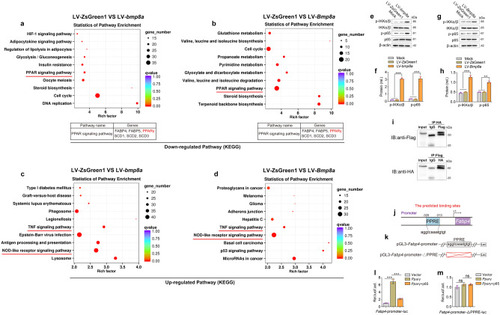
The interaction of NF-ĸB and PPARγ mediates the effect of Bmp8a on adipogenesis.

a, c After induction of adipogenic differentiation, the downregulated (a) and upregulated (c) KEGG pathway in overexpression zebrafish bmp8a 3T3-L1 cells. b, d After induction of adipogenic differentiation, the downregulated (b) and upregulated (d) KEGG pathway in overexpression mouse Bmp8a 3T3-L1 cells. e, f Immunoblot analysis and quantification of p-IKKα/β and p-p65 in Mock, LV-ZsGreen1, and LV-bmp8a 3T3-L1 cells (n = 3). g, h Immunoblot analysis and quantification of p-IKKα/β and p-p65 in Mock, LV-ZsGreen1, and LV-Bmp8a 3T3-L1cells. Protein expression levels were quantified by ImageJ software and normalized to total protein (n = 3). i Co-immunoprecipitation and immunoblot analysis of co-transfected with PPARγ and p65 (n = 3). j Schematic drawing of predicted PPRE site in Fabp4 promoter region. k Schematic drawing of WT and PPRE site mutation Luc-report plasmids. l, m Quantification of the activity of Fabp4-promoter (l) and Fabp4-promoter-ΔPPRE (m) luciferase reporters in mouse HEK293T cells transfected with Vector, pCMV-Pparγ, or co-transfected pCMV-Pparγ and pCMV-p65, respectively. Renilla luciferase was used as the internal control (n = 3). Data were from three independent experiments and were analyzed by One-way ANOVA and were presented as mean ± SD (ns not significant, **p < 0.01, ***p < 0.001).

Schematic illustration of Bmp8a effect on the regulation of lipid metabolism and adipocyte differentiation.

Bmp8a is required for fatty acid oxidation and regulates adipogenesis as evidenced by weight gain and fatty liver of zebrafish lacking Bmp8a.

Acknowledgments
This image is the copyrighted work of the attributed author or publisher, and ZFIN has permission only to display this image to its users. Additional permissions should be obtained from the applicable author or publisher of the image. Full text @ Commun Biol