
- Title
-
Label-free adaptive optics single-molecule localization microscopy for whole zebrafish
- Authors
- Park, S., Jo, Y., Kang, M., Hong, J.H., Ko, S., Kim, S., Park, S., Park, H.C., Shim, S.H., Choi, W.
- Source
- Full text @ Nat. Commun.
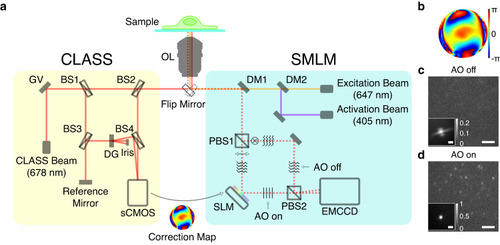
a Simplified layout of the experimental setup composed of the CLASS microscope (yellow box) and SMLM (cyan box). OL objective lens, GV two-axis galvanometer mirror, DG diffraction grating, BS1-4 beam splitters, DM1-2 dichroic mirrors, PBS1-2 polarizing beam splitters, SLM spatial light modulator, and gray rectangles without labels: mirrors. b Aberration correction map whose radius is 1.2/λ in spatial frequency where λ is the emission peak wavelength of Alexa Fluor 647. c, d Single-frame raw images of single-molecule PSFs simultaneously recorded without (c) and with (d) AO, respectively. Images are normalized with respect to AO on. Insets show ensemble-averaged normalized PSFs of the first 10,000 frames. Scale bars indicate 2.5 μm and 500 nm (insets). Source data are provided as a Source Data file. |
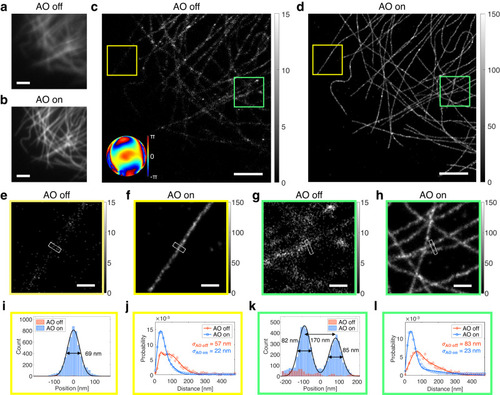
a, b Diffraction-limited fluorescence images without (a) and with (b) AO, respectively. Images are normalized with respect to AO on. Scale bars indicate 2.5 μm. c, d SMLM images without (c) and with (d) AO, respectively. Inset in (c) indicates the aberration correction map. Color bars indicate localization numbers. Scale bars indicate 2.5 μm. |

a SMLM images of dendritic spines at the depth of 50 μm in a 150-μm-thick mouse brain slice without and with AO. Bottom-left inset in AO-off image shows aberration correction map. The FWHM value of a dendritic spine neck is indicated by an arrowhead. Color bars indicate localization numbers. Scale bars indicate 2 μm. b, c Magnified views of regions indicated by arrows in (a). FWHM values of dendritic spine necks (white boxes) are written in AO-on images. Color bars indicate localization numbers. Scale bars indicate 500 nm. d, e Histograms of photon number per emission PSF (d) and nearest neighbor analysis results (e) of (a). f SMLM images of dendritic spines at the depth of 74 μm in a 200-μm-thick mouse brain slice without and with AO. Top-left inset in AO-off image shows aberration correction map. Color bars indicate localization numbers. Scale bars indicate 2.5 μm. g–i Magnified views of regions indicated by arrows in (f). FWHM values of dendritic spine necks (white boxes) are written in AO-on images. Color bars indicate localization numbers. Scale bars indicate 500 nm. j, k Histograms of photon number per emission PSF (j) and nearest neighbor analysis results (k) of (f). Source data are provided as a Source Data file. |
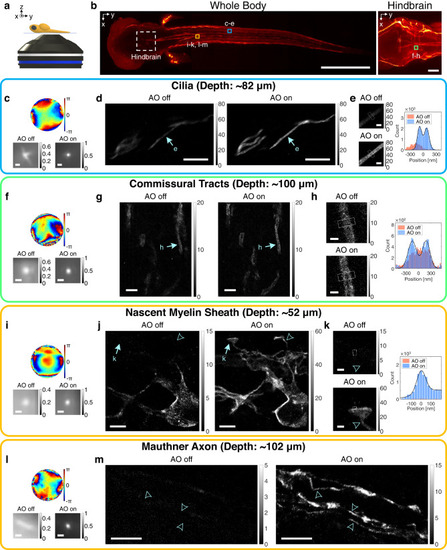
a A diagram showing a whole zebrafish larva mounted on a cover glass. b Confocal fluorescence images of the whole body (left column) and hindbrain (right column). Dashed square indicates hindbrain region. Colored squares roughly indicate SMLM imaging regions. Scale bars indicate 500 μm (left column) and 50 μm (right column). c–e SMLM imaging of cilia in a whole 3-dpf zebrafish at the depth of 82 μm. Aberration correction map (top row in c), ensemble-averaged normalized PSFs of the first 10,000 frames (bottom row in c), and SMLM images (d). Magnified views of regions indicated by arrows in (d) (left column in e) and cross-sectional profiles of white boxes (right column in e). Color bars in (d, e) indicate localization numbers. Scale bars indicate 500 nm (c), 5 μm (d), and 500 nm (e). f–h Same as (c–e), but for oligodendrocytes at the hindbrain in a whole 5-dpf zebrafish at the depth of 100 μm. Scale bars indicate 500 nm (f), 2.5 μm (g), and 500 nm (h). i–k Same as (f–h), but for oligodendrocytes near spinal cords in a whole 3.5-dpf zebrafish at the depth of 52 μm. Scale bars indicate 500 nm (i), 2.5 μm (j), and 500 nm (k). l, m Same as (i, j), but for oligodendrocytes near spinal cords in a whole 5-dpf zebrafish at the depth of 102 μm. Arrowheads indicate sites with FWHM measured as 160, 150, and 160 nm from bottom to top. Scale bars indicate 500 nm (l) and 5 μm (m). Source data are provided as a Source Data file. |