FIGURE SUMMARY
Title

Bone mineral density loci specific to the skull portray potential pleiotropic effects on craniosynostosis

Authors
Medina-Gomez, C., Mullin, B.H., Chesi, A., Prijatelj, V., Kemp, J.P., Shochat-Carvalho, C., Trajanoska, K., Wang, C., Joro, R., Evans, T.E., Schraut, K.E., Li-Gao, R., Ahluwalia, T.S., Zillikens, M.C., Zhu, K., Mook-Kanamori, D.O., Evans, D.S., Nethander, M., Knol, M.J., Thorleifsson, G., Prokic, I., Zemel, B., Broer, L., McGuigan, F.E., van Schoor, N.M., Reppe, S., Pawlak, M.A., Ralston, S.H., van der Velde, N., Lorentzon, M., Stefansson, K., Adams, H.H.H., Wilson, S.G., Ikram, M.A., Walsh, J.P., Lakka, T.A., Gautvik, K.M., Wilson, J.F., Orwoll, E.S., van Duijn, C.M., Bønnelykke, K., Uitterlinden, A.G., Styrkársdóttir, U., Akesson, K.E., Spector, T.D., Tobias, J.H., Ohlsson, C., Felix, J.F., Bisgaard, H., Grant, S.F.A., Richards, J.B., Evans, D.M., van der Eerden, B., van de Peppel, J., Ackert-Bicknell, C., Karasik, D., Kague, E., Rivadeneira, F.
Source
Full text @ Commun Biol

Regional plots for the four novel loci associated with SK-BMD (P < 5 × 10−8).

Circles show GWAS meta-analysis P-values and position of SNPs for the overall meta-analysis (n = 43,800). Different colors indicate varying degrees of pair-wise linkage disequilibrium with the top marker (1000 Genomes—CEU population).

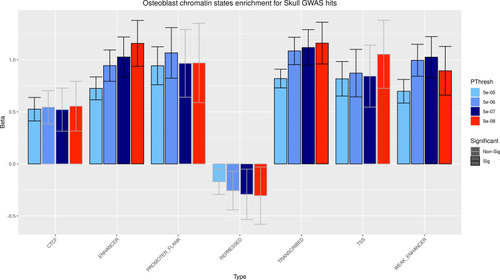
GARFIELD results for chromatin states enrichment analysis in osteoblasts.

Enrichment significance was defined at P < 4.31 × 10−4 (116 effective tests performed). Bar-plot fill colors represent p-value GWS threshold of variants included in the analysis. Bar-plot outline colors represent significance of the enrichment. GWS variants were enriched for enhancer, weak enhancer and transcribed osteoblast regions.

DEPICT results for gene-set and cell/tissue enrichment analyses.

a Meta gene-sets were defined from similarity clustering of significantly enriched gene sets (FDR < 5%). Each Meta gene-set was named after one of its member gene-sets. The color of the Meta gene-sets represents the P value of the member set. Interconnection line width represents the Pearson correlation ρ between the gene membership scores for each Meta gene-set (ρ < 0.3, no line; 0.3 ≤ρ < 0.45, narrow width; 0.45 ≤ρ < 0.65, medium width; ρ ≥ 0.65, thick width). b Bars represent the level of evidence for genes in the associated loci to be expressed in any of the 209 Medical Subject Heading (MeSH) tissue and cell type annotations. Highlighted in orange are these cell/tissue types significantly (FDR < 5%) enriched for the expression of the genes in the associated loci.

Rapid functional evaluation of novel BMD associated genes in zebrafish identifies a role of novel gene atp6v1c1 in skull development and a role of prkar1a in bone growth.

a Schematic of skull formation in zebrafish. Four ossification centres (grey) are formed by condensation of osteoblasts in the periphery of the skull at around 3 weeks post-fertilization (wpf). Ossification planes grow towards the centre of the skull forming the frontal (F) and parietal (P) bones, completely covering the brain at 7wpf and forming the metopic (m), coronal (c) and sagittal (s) sutures. b Schematics of the zebrafish crispant experiments. Fish carrying osteoblast reporter line Tg(Ola.Sp7:NLS-gfp) were crossed, and embryos at one cell stage were injected with the CRISPR/Cas9 system targeting respective genes. Observations were carried out in vivo during skull/suture formation (5-7wpf). Scale bars = 500 um. c Live imaging of skulls and ex vivo Alizarin Red Staining of control, and zic1, atp6v1c1 (a + b) and prkar1a (a + b) crispants. Ectopic sutures are indicated with green arrowheads in zic1 and atp6v1c1 (a + b) crispants. Sutures were outlined with a dashed line in Alizarin Red pictures. Cavities in the skull are indicated with magenta arrowheads in prkar1a (a + b) crispant. Scale bars = 500 um. d 3D renders micro-computed topographies (µCTs) images of the skull. Images were colour-coded to show BMD variation. eh Site-specific BMD measurements of fish of similar standard size. Data are mean ± SD. All P-values are indicated. Graphs were generated in Prism 8. e, g Comparison of zic1 (n = 6), atp6v1c1 (a + b) (n = 3) crispants and controls (n = 6). Standard size 1.8 cm. One-way ordinary ANOVA, multiple comparisons test f, h Comparison of prkar1a (a + b) crispants (n = 3) and controls (n = 3). Standard size 1.6 cm. Nonparametric, Two-tailed, T-tests.

Acknowledgments
This image is the copyrighted work of the attributed author or publisher, and ZFIN has permission only to display this image to its users. Additional permissions should be obtained from the applicable author or publisher of the image. Full text @ Commun Biol