
- Title
-
Mutations in cdon and boc affect trunk neural crest cell migration and slow-twitch muscle development in zebrafish
- Authors
- Lencer, E., Rains, A., Binne, E., Prekeris, R., Artinger, K.
- Source
- Full text @ Development

cdon and boc are transmembrane receptors and share conserved domain structure. (A) cdon and boc share a domain structure of four or five immunoglobin (IG) domains, three fibronectin (FNIII) domains, a transmembrane (TM) region and a cytosolic C-terminal tail. A fifth cdon IG domain (*) is found in some tetrapod taxa. Percent conservation (20 amino acid sliding window) is shown for an alignment of cdon and boc amino acid sequences from 11 tetrapod and ray-finned fish taxa. The extracellular domains exhibit high sequence conservation, while the cytosolic region is less conserved. (B) Maximum likelihood tree (phyml) for curated cdon and boc ortholog amino acid sequences from multiple bilaterian taxa. There are independent duplications of Ihog/Boi in drosophilids and of Cdon/Boc in vertebrates. Node support was calculated based on 1000 bootstraps; nodes with less than 60% bootstrap support are shown in gray. Asterisks indicate taxa used to generate conservation in A. Lamprey cdon and boc sequences are uncolored due to topological position as an outgroup with respect to vertebrate cdon sequences. (C) Schematic of cdon and boc mutant alleles characterized in the current study. |
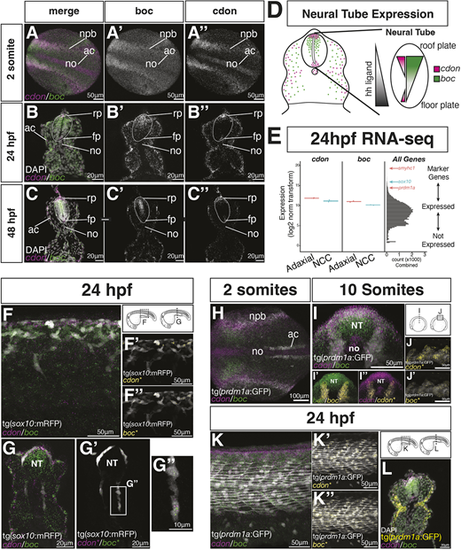
cdon and boc are expressed by NCCs and adaxial mesoderm cells. (A-C) Hybrid chain reaction in situ hybridization (HCR) shows cdon (magenta) and boc (green) expression in the developing neural tube of two somites shown in a dorsal view (A), and in 24 hpf (B) and 48 hpf (C) cross-sectioned embryos (20 µm sections at the level of the yolk extension). (D) Schematic of a cross-section at yolk extension summarizing cdon and boc expression in the neural tube. The gradient of hedgehog ligand is indicated in gray. (E) Bulk RNA-seq from two replicate samples of FAC-sorted tNCCs (blue) and slow-twitch muscle (red) suggest both tissues express cdon and boc. Right panel is a histogram of gene expression levels for all samples for all genes. Location of genes known to mark NCCs (blue) or slow-twitch muscle (red) are indicated. (F) Whole-mount lateral view of 24 hpf embryo showing expression of cdon and boc with NCCs (gray) labeled by the tg(sox10:mRFP) transgene at level of yolk extension. (F′,F″) HCR puncta overlapping the sox10 transgene (*) are shown in yellow. (G-G″) Cross-section shows tNCCs expressing cdon and boc transcripts. (H-L) HCR expression of cdon and boc in adaxial mesoderm labeled with the tg(prdm1a:eGFP) transgene (gray). (H) Dorsal view of a two-somite embryo. (I-J′) Optical cross-sections (I-I″) and lateral views (J,J′) of a 10-somite embryo. (I′,I″,J,J′) HCR puncta overlapping the tg(prdm1a:eGFP) transgene are shown in yellow. Only HCR puncta overlapping the tg(prdm1a:eGFP) transgene are shown in J and J′. (K) Lateral view of 24 hpf embryo showing cdon and boc transcripts in slow-twitch muscle. K′ and K″ show overlapping puncta labeled in yellow. (L) Cross-section of a 24 hpf embryo shows tg(prdm1a:eGFP) in yellow, cdon/boc puncta in slow-twitch muscle along with the nuclear marker DAPI in white. ac, adaxial cells; fp, floor plate; no, notochord; rp, roof plate. |
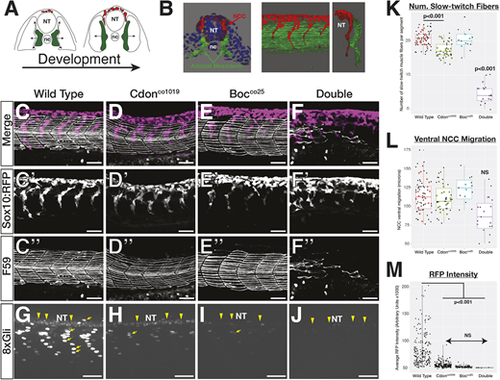
cdon and boc affect NCC migration and slow-twitch muscle differentiation. (A) Schematic cross-sections of a 10-somite to 24 hpf embryo show NCC (red) and adaxial mesoderm (green) migration. Adaxial cells in green are specified adjacent to the notochord and migrate laterally to differentiate into slow-twitch muscle. NCCs (red) migrate ventrally from the dorsal neural tube. (B) 3D renderings of a 10 μm cross-section from the trunk of a 15-somite (left) and a whole-mount 24 hpf embryo (right) showing association between migrating adaxial mesoderm (green) and NCCs (red). (C-F) Lateral views of maximum projection images show NCC streams, tg(sox10:mRFP) and immunostaining for slow-twitch muscle (F59; white) in 24 hpf wild-type embryos at the level of yolk extension. Single fluorescent images are shown in black and white below for tNCC (C′-F′) and adaxial cells (C″-F″). (G-J) Maximum projection images of tg(8×Gli:mCherry) transgene in 24 hpf embryos. There are mCherry-positive nuclei in slow-twitch muscle (yellow arrows) and neural tube (yellow arrowheads). (K-M) Quantification of (K) the number of F59 stained fibers per segment in each genotype, (L) ventral migration of the NCC stream, and (M) mCherry intensity. For K and L, black dots represent individual segments and colored dots represent individual averages. Horizontal line in box plot indicates the median. Lower and upper edges of boxes indicate the first and third quartiles, respectively. Whiskers indicate minimum and maximum values. NT, neural tube; nc, notochord. |

cdon and boc sensitize zebrafish embryos to a reduction in hedgehog signal by cyclopamine treatment. (A) Lateral views of representative images show slow-twitch muscle fiber morphology in 24 hpf embryos treated with either 20µM cyclopamine or an equivalent volume of ethanol as a control. cdon and boc mutants exhibit more severe phenotypes when treated with cyclopamine, as evidenced by gaps in segments (arrows), and complete loss of slow-twitch muscles in the double mutants. (B) Quantification of average number of slow-twitch muscle fibers per segment shows that cdon and boc mutations are sensitizing embryos to cyclopamine treatment. All images and data are taken from segments at the level of the yolk extension. Horizontal line in box plot indicates the median. Lower and upper edges of boxes indicate the first and third quartiles, respectively. Whiskers indicate minimum and maximum values. Significance values are from Tukey pairwise post-hoc tests (*P<0.05, ***P<0.001). |

NCC directionality, but not motility, is disrupted in cdon;boc mutants. (A) Maximum projection images show migrating tNCCs in representative wild-type, cdon, boc and double mutant embryos over a 6 h time period at the level of yolk extension. Colored lines are tracks of individual cells. There are horizontal tracks at body midline in double mutant embryos. Matched rose plots (right panels) show directional movement of NCCs in each genotype. Samples sizes reflect number of tracks/number of embryos. (B) Migration tracks overlaid onto outlines of somites (gray dashed lines) for representative embryos. Somite segments in the double mutant are wider and dysmorphic. (C-G) Quantification of NCC migration for maximum velocity (C), mean velocity (D), track length (E), track displacement (F) and track directionality (G). Small gray points are individual track values; large colored points are means for individuals; boxplots reflect variability across tracks. (H) Schematic of track straightness calculated as track displacement divided by track length. All images and data are taken at yolk extension. Horizontal line in box plot indicates the median. Lower and upper edges of boxes indicate the first and third quartiles, respectively. Whiskers indicate minimum and maximum values. |

Transplant and smo overexpression experiments in cdon/boc double mutants suggest a possible non-autonomous role. (A,B) Wild-type (A) and mutant (B) tNCCs transplanted into wild-type hosts. Double mutant cdon;boc tNCCs migrate normally in wild-type hosts when transplanted into the trunk (B, 3/3 embryos). (C, top) tol2 constructs used for rescues. Dorsal view of a 10-somite embryo shows mosaic expression in adaxial cells. (C, bottom) Mosaic expression of smoa1-eGFP in adaxial cell progenitors. (D) Lateral view of slow-twitch muscle morphology (F59; magenta) and tNCC streams (yellow) in a double mutant embryo injected with control eGFP construct. (E) Quantification of NCC ventral migration (as percent of somite length) in control- and smoa1-eGFP-injected embryos. Colors indicate qualitative rescue of the NCC stream. Control injected, n=4 embryos; smoa1a-eGFP injected, n=8 embryos. (F-H) Representative images of smoa1a-eGFP-injected embryos. (F) Left side of an embryo where tNCC migration (yellow) was not rescued. (G) Right side of same embryo where tNCC migration was rescued. Note the slow-twitch muscle fiber morphology (magenta). (H) Mosaic expression of smoa1a-eGFP (cyan). Arrows indicate segments with qualitatively rescued tNCC streams. Asterisks label segments with non-rescued streams, ‘p’ labels a representative ‘partial rescue’. |

Col1a1a matrix deposition in cdon;boc mutants. (A) RNA-seq from FAC sorted tg(prdm1a:eGFP) cells at 24 hpf identify expression of collagen genes. (B) 3D projections of Col1a1a deposition at the level of yolk extension. At 20 hpf, Col1a1a expression is strongest in the vertical myosepta (arrows). (C) Medial view shows Col1a1a deposition along the somite-notochord boundary in wild-type and double mutant embryos at 24 hpf. Col1a1a signal in skin ectoderm was removed for images in C. The loss of Col1a1a in the double mutant is associated with loss of slow-twitch muscle differentiation (arrows). Retention of Col1a1a around dorsal neural tube (arrows) coincides with the location of tNCC migration arrest. (D) Volume rendering shows medial deposition of Col1a1a in wild-type (top) and double mutant (bottom) embryos at 24 hpf. (E) Optical cross-section shows loss of medial Col1a1a deposition along the NCC migratory path (arrows) in double mutant embryos at 24 hpf. (F) Line scan quantification showing reduced Col1a1a intensity in double mutant embryos. Line scans taken on optically sectioned images and normalized for length and intensity. NC, notochord; NT, neural tube; mp, muscle pioneers; vms, vertical myosepta. |