FIGURE SUMMARY
Title

Short-Term TERT Inhibition Impairs Cellular Proliferation via a Telomere Length-Independent Mechanism and Can Be Exploited as a Potential Anticancer Approach

Authors
Amin, A., Morello, M., Petrara, M.R., Rizzo, B., Argenton, F., De Rossi, A., Giunco, S.
Source
Full text @ Cancers

Telomerase inhibition altered RELA proto-oncogene NF-kB subunit (p65) nuclear levels. (A,B) Cells were treated with indicated concentrations of BIBR1532 (BIBR) or dimethyl sulfoxide (DMSO) as control, for 24 h. Levels of relative mRNA expression for p65 in 4134/Late (A) and BL41 (B) cells are shown. Data represent the mean and standard deviation (SD, bar) from three separate experiments. (C,D) Cells treated with BIBR at indicated concentrations, or DMSO as control, for 24 h were processed to obtain cytoplasmic and nuclear extracts. Representative Western blots showing cytoplasmic and nuclear protein levels of p65, phospho-p65 (p-p65), telomeric repeat binding factor 2 (TRF2), and α-tubulin in 4134/Late (C) and BL41 (D) cells are shown. α-tubulin and TRF2 were used as loading controls for the cytoplasmic and nuclear fractions, respectively. The original Western blots are shown in File S1. Graphs next to the blots show the values in arbitrary units of densitometric analysis performed with ImageJ software. Data represent the mean and SD (bar) from three separate experiments. A significant difference between values in BIBR-treated vs. DMSO-treated cells is shown: * p < 0.05; ** p < 0.01; ns: not significant.

Telomerase reverse transcriptase (TERT) inhibition downregulated MYC proto-oncogene bHLH transcription factor (MYC) levels. (A,B) Cells were treated with BIBR at indicated concentrations or with DMSO as a control for 24 h. Levels of relative mRNA expression for MYC and TERT in 4134/Late (A) and BL41 (B) cells are shown. Data represent the mean and SD (bar) from three separate experiments. (C,D) Cells treated with BIBR at indicated concentrations or DMSO as a control for 24 h were processed to obtain cytoplasmic and nuclear extracts. Representative Western blots showing cytoplasmic and nuclear protein levels of TERT, MYC, TRF2, and α-tubulin in 4134/Late (C) and BL41 (D) cells are shown. α-tubulin and TRF2 were used as loading controls for the cytoplasmic and nuclear fractions, respectively. The original Western blots are shown in File S1. Graphs next to the blots show the values in arbitrary units of densitometric analysis performed with ImageJ software. Data represent the mean and SD (bar) from three separate experiments. A significant difference between values in BIBR-treated vs. DMSO-treated cells is shown: * p < 0.05; ** p < 0.01; *** p < 0.001; ns: not significant.

Ectopic expression of TERT or TERT-HA increased transcription of NF-κB target genes. U2OS cells were transfected with pBABE-hTERT, pBABE-hTERT-HA, or pBABE (control) vectors. Forty-eight h after transfection, RNA was harvested and mRNA levels for the genes indicated were determined by quantitative RT-PCR. Data represent the mean and SD (bar) from three separate experiments. A significant difference between values in pBABE-hTERT or pBABE-hTERT-HA transfected cells vs. control pBABE-transfected cells is shown: * p < 0.05; ** p < 0.01; ns: not significant.

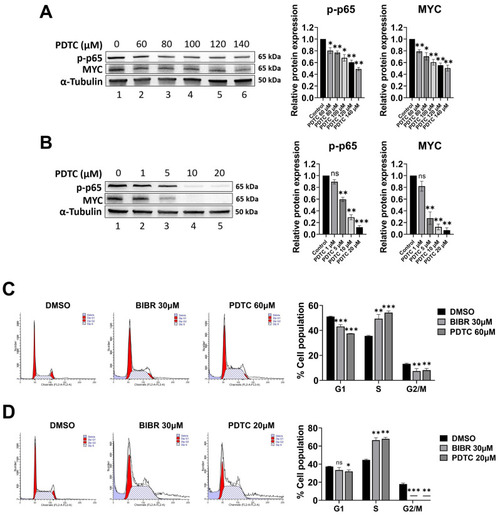
p65 inhibition recapitulated the effects of TERT inhibition on MYC and the cell cycle. (A,B) Representative Western blots showing total protein levels of p-p65 and MYC in 4134/Late (A) and BL41 (B) cells upon treatment with Ammonium pyrrolidine dithiocarbamate (PDTC) at the indicated concentrations for 24 h. α-tubulin was used as a loading control. The original Western blots are shown in File S1. Graphs on the right show the values in arbitrary units of densitometric analysis performed with ImageJ software. Data represent the mean and SD (bar) from two separate experiments. (C,D) 4134L/Late (C) and BL41 (D) cells were treated with 30 μM BIBR, PDTC at indicated concentrations, or DMSO as a control for 24 h, labelled with propidium iodide (PI) and analysed by flow cytometry for cell cycle profiles. Panels from a representative experiment are shown. Graphs on the right show percentages of cells in G1, S, and G2/M-phases, respectively. Values show the means and SD (bar) of three separate experiments. A significant difference between values in BIBR-treated or PDTC-treated cells vs. DMSO-treated cells is shown: * p < 0.05; ** p < 0.01; *** p < 0.001.

Telomerase inhibition enhanced the expression and nuclear localization of cyclin-dependent kinase inhibitor 1A (CDKN1A, P21). (A,C) Cells were treated with 30 μM BIBR or DMSO as a control for 24 h. Levels of relative mRNA expression for P21 in 4134/Late (A) and BL41 (C) are shown. Data represent the mean and SD (bar) from three separate experiments. (B,D) 4134/Late (B) and BL41 (D) cells treated with 30 μM BIBR or DMSO as a control for 24 h were processed to obtain cytoplasmic and nuclear extracts. The indicated proteins were probed by Western blotting and representative blots are shown. α-tubulin and TRF2 were used as loading controls for the cytoplasmic and nuclear fractions, respectively. The original Western blots are shown in File S1. Graphs show the values in arbitrary units of densitometric analysis performed with ImageJ software. Data represent the mean and SD (bar) from three separate experiments. (E,F) Representative immunofluorescence images showing P21 (green), PI (nuclear marker, red), and their merge in 4134/Late (E) and BL41 (F) cells treated with 30 μM BIBR or DMSO as a control (magnification 20× unless specified). Graphs show the values in arbitrary units of densitometric analysis performed with ImageJ software. Data represent the mean and SD (bar) from two separated experiments, scale bars: 100 μm in 20× and 5 μm in 63× images. A significant difference between values in BIBR-treated vs. DMSO-treated cells is shown: * p < 0.05; ** p < 0.01; *** p < 0.001; ns: not significant.

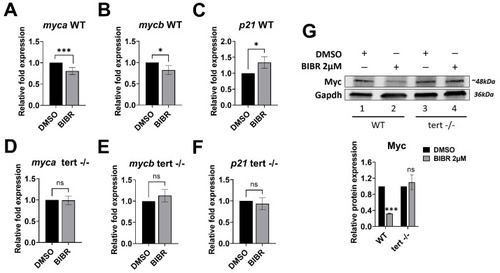
BIBR treatment downregulated the expression of zebrafish myca and mycb and upregulated p21. Twelve hours post fertilization (hpf), zebrafish wild-type (WT) and tert mutant (terthu3430/hu3430; tert −/−) embryos were treated with 2 μM BIBR or DMSO as a control for 12 h, from 12 to 24 hpf. Levels of relative mRNA expression for the indicated genes in WT (AC) and tert mutant (DF) embryos are shown. Data represent the mean and SD (bar) from three separate experiments. (G) Representative Western blots showing total protein levels of Myc in WT and tert mutant zebrafish embryos upon treatment with 2 μM BIBR for 12 h. Glyceraldehyde-3-phosphate dehydrogenase (Gapdh) was used as a loading control. The original Western blots are shown in File S1. The graph shows the values in arbitrary units of densitometric analysis performed with ImageJ software. Data represent the mean and SD (bar) from two separate experiments. A significant difference between values in BIBR-treated embryos vs. DMSO-treated embryos is shown: * p < 0.05; *** p < 0.001; ns: not significant.

Combined treatment with BIBR and fludarabine (FLU) or cyclophosphamide (CY) inhibited the growth of EBV-immortalized and fully transformed B cells xenografted in zebrafish. 4134/Late (A) and BL41 (B) cells were pre-treated with 30 μM BIBR (pre-BIBR) or DMSO (pre-DMSO) as a control for 16 h, stained with CM-DiI, and xenotransplanted in the yolk sac of 72 hpf embryos. Twenty-four hours post-xenotransplantation, xenografted embryos were divided into groups untreated (NT) or treated with FLU or CY. The percentage of tumour cells in engrafted embryos was determined at 24, 48, and 72 h post-treatment (hpt) by flow cytometric analysis. Data represent the mean and SD (bar) from three separate experiments with 10 embryos per group. ns: not significant, *, and • p < 0.05; ** and ▼▼ p < 0.01; *** p < 0.001, where (*) asterisks represent the statistical significance vs. the pre-DMSO NT group; the (▼) symbol shows the statistical significance of the combined treatment with BIBR and CY or FLU vs. the respective drug treatment alone and the (•) symbol shows the statistical significance of the combined treatment with BIBR and CY or FLU vs. the BIBR treatment alone.

Acknowledgments
This image is the copyrighted work of the attributed author or publisher, and ZFIN has permission only to display this image to its users. Additional permissions should be obtained from the applicable author or publisher of the image. Full text @ Cancers