
- Title
-
Extensive jejunal injury is repaired by migration and transdifferentiation of ileal enterocytes in zebrafish
- Authors
- Wei, X., Tan, X., Chen, Q., Jiang, Y., Wu, G., Ma, X., Fu, J., Li, Y., Gang, K., Yang, Q., Ni, R., He, J., Luo, L.
- Source
- Full text @ Cell Rep.
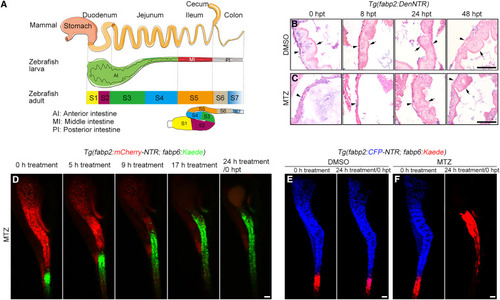
Ileal enterocytes migrate to the extensively injured jejunum (A) The anterior, middle, and posterior intestine of zebrafish larvae correspond to mammalian duodenum plus jejunum, ileum, and colon, respectively. The S1-S2, S3-S4, S5, and S6-S7 intestinal segments of zebrafish adults are equivalent to mammalian duodenum, jejunum, ileum, and colon, respectively. (B and C) In contrast to the uninjured intestine (B), H&E staining showed that the intestinal villi collapsed at 0 hpt and 8 hpt after MTZ-induced injury, then rapidly recovered at 24 hpt and 48 hpt (C). The arrowheads indicate basement membrane, while the arrows indicate villus. (D) Live imaging showed that the Kaede-green+ ileal enterocytes quickly responded to the MTZ-induced jejunal injury and migrated into the jejunum. See Video S1. (E and F) Photoconversion of Kaede-green to Kaede-red showed that in contrast to the uninjured control (E), the Kaede-red+ ileal enterocytes migrated into jejunum in response to extensive jejunal enterocyte damage (F). “24 h treatment” is equivalent to 0 hpt. Scale bars, 50 μm. See also Figures S1 and S2. |
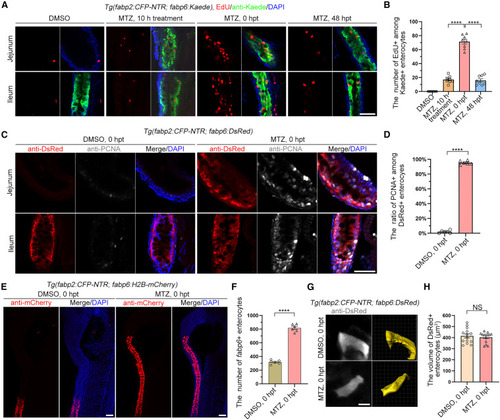
Ileal enterocytes proliferate after jejunal damage (A) In the uninjured control, the ileal enterocytes rarely underwent mitosis. By contrast, with MTZ treatment from 10 h to 0 hpt, the EdU+ enterocytes gradually increased and then decreased at 48 hpt. (B) Graph showing quantification of EdU+ cells among Kaede+ enterocytes (n = 8). Data are presented as mean ± SEM. ∗∗∗∗p < 0.0001, two-tailed unpaired t test. (C) In contrast to uninjured intestine, the fabp6+ enterocytes of injured intestine highly expressed PCNA at 0 hpt. (D) Graph showing quantification of ratio of PCNA+ among DsRed+ enterocytes (n = 6). Data are presented as mean ± SEM. ∗∗∗∗p < 0.0001, two-tailed unpaired t test. (E) Compared with DMSO treatment, fabp6+ enterocytes increased cell number after intestinal injury. (F) Graph showing quantification of number of fabp6+ enterocytes (n = 6). Data are presented as mean ± SEM. ∗∗∗∗p < 0.0001, two-tailed unpaired t test. (G) Cell size of fabp6+ enterocytes during MTZ treatment. (H) Graph showing quantification of volume of fabp6+ enterocytes (n = 14). Data are presented as mean ± SEM. Not significant (NS), two-tailed unpaired t test. Scale bars, 5 μm (G) and 50 μm (A, C, and E) |
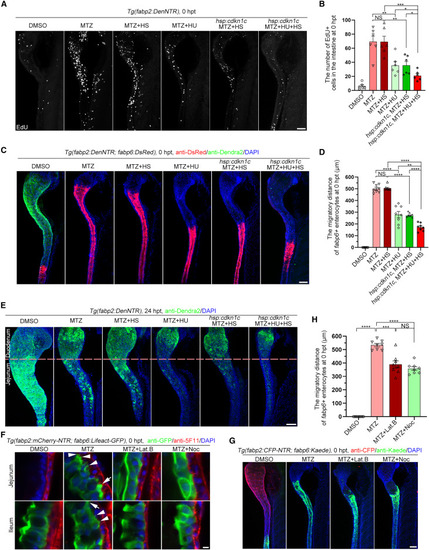
Cell division and filopodia/lamellipodia are essential for ileal enterocyte migration and jejunal regeneration (A) During the MTZ-induced injury, incubation with hydroxyurea (HU) or overexpression of cdkn1c alone, or HU treatment together with cdkn1c overexpression, significantly reduced the cell proliferation. (B) Statistics showing the number of EdU+ cells in the intestine (n = 6). Data are presented as mean ± SEM. ∗p < 0.05, ∗∗p < 0.01, ∗∗∗p < 0.001, two-tailed unpaired t test; NS, not significant. (C and D) During the MTZ-induced injury, incubation with HU or overexpression of cdkn1c alone, or HU treatment together with cdkn1c overexpression, significantly reduced the migration distance of ileal enterocytes (C), which was validated by the statistical analyses (D, n = 8). Data are presented as mean ± SEM. ∗∗∗p < 0.01, ∗∗∗∗p < 0.0001, two-tailed unpaired t test; NS, not significant. (E) Jejunal regeneration was significantly impaired by incubating with HU or overexpression of cdkn1c alone, or HU treatment together with cdkn1c overexpression from MTZ treatment to 24 hpt. (F–H) Migratory ileal enterocytes formed filopodia (white arrowheads) and lamellipodia (white arrows). The microfilament inhibitor Lat.B and microtube inhibitor Noc blocked the formation of lamellipodia and filopodia (F), then repressed the ileal enterocyte migration (G), which was validated by the statistical analyses (H, n = 8). Data are presented as mean ± SEM. ∗∗∗p < 0.001, ∗∗∗∗p < 0.0001, two-tailed unpaired t test; NS, not significant. Lat.B, latrunculin B; Noc, nocodazole; HS, heat shock. Scale bars, 5 μm (F) and 50 μm (A, C, E, and G). See also Figure S3. |

Migrated ileal enterocytes transdifferentiate into jejunal enterocytes (A) Compared with the uninjured larvae under the Tg(fabp2:DenNTR; fabp6:dsRed) transgenic background, fabp6+ enterocytes migrated to jejunum at 0, 8, and 48 hpt. The migrated DsRed+ enterocytes in the injured jejunum expressed the fabp2:Dendra2 transgene at 48 hpt. The dash-framed areas are enlarged in the panels on their right. (B) Graph showing quantification of migratory distance (n = 6). Data are presented as mean ± SEM. Not significant (NS), two-tailed unpaired t test. (C–G) Stratagy of 4-OHT treatment (C). The Cre/loxP-mediated lineage tracing of ileal enterocytes. Uninjured larvae treated with 4-OHT served as the positive control, in which the ileal enterocytes were labeled with GFP (D). Negatively controlled by ethanol plus MTZ treatment (E), larvae treated with 4-OHT and MTZ exhibited GFP+Dendra2+ enterocytes in the injured jejunum (F). The dash-framed areas are enlarged in the right-hand panel. The statistics show that approximately 60% of the regenerated jejunal enterocytes were positive for GFP at 48 hpt (G, n = 7). Data are presented as mean ± SEM. ∗∗∗∗p < 0.0001, two-tailed unpaired t test. (H) A total of 8,234 cells were used for pseudotime trajectory of fabp2+ enterocyte, fabp6+ enterocyte, and precursor-like. The gradient from dark to light blue denotes the time increment. The seven states were identified by gene expression profiles in pseudotime. (I) BODIPY FL C5 green fluorescent droplets indicate lipid absorption. The enterocytes in the ileum are devoid of lipid uptake function (arrows). However, the ileal enterocytes migrated into the injured jejunum at 48 hpt and gained the function of lipid absorption (arrowheads). (J) Graph showing quantification of rate of BODIPY FL C5+ among DsRed+ enterocytes. Data are presented as mean ± SEM. ∗∗∗∗p < 0.0001, two-tailed unpaired t test. Scale bars, 50 μm. See also Figures S4 and S5. |

Ileal enterocytes contribute to jejunal enterocyte regeneration in adult zebrafish (A) The adult zebrafish intestine is subdivided into seven segments (S1 to S7). (B–D) H&E staining shows that in contrast to the uninjured control (B), the jejunal villi in S4 collapsed at 0 hpt and underwent morphological reconstructing at 72 hpt, whereas the ileal villi in S5 remained unaffected (C and D). (E–G) In the uninjured Tg(fabp2:DenNTR; fabp6:dsRed) transgenic adults, DsRed+ enterocytes were present in S5 but not in S4 (E). After MTZ-induced injury at 0 hpt, the DsRed+ enterocytes were observed in S4 (F), which became more evident at 72 hpt (G). The dash-framed areas are enlarged in the panels on their right. Scale bars, 50 μm. |
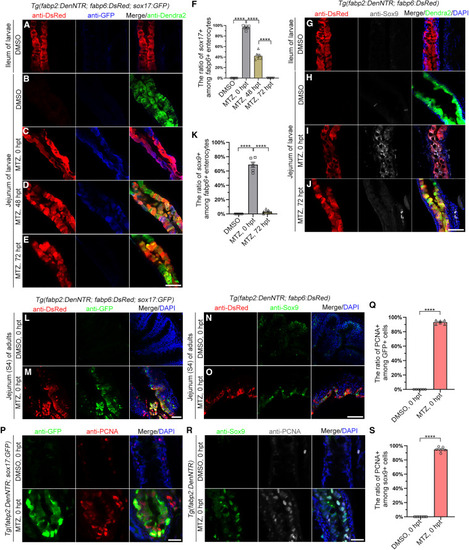
Migrated ileal enterocytes in both larvae and adults express gut precursor markers (A–K) In the uninjured larvae, ileal enterocytes did not express sox17:GFP transgene and Sox9 (A and G). In the MTZ-injured larvae, the migrated DsRed+ ileal enterocytes in the jejunum expressed the sox17:GFP transgene (B and C) and Sox9 (H and I) at 0 hpt, followed by expression of Dendra2 at 48 hpt (D), finally downregulating sox17:GFP transgene (E) and Sox9 (J) at 72 hpt. (F) Graph showing quantification of ratio of Sox17+ among DsRed+ enterocytes (n = 6). (K) Graph showing quantification of ratio of Sox9+ among DsRed+ enterocytes (n = 6). Data are presented as mean ± SEM. ∗∗∗∗p < 0.0001, two-tailed unpaired t test. (L–O) Similarly, in MTZ-injured adults, the migrated DsRed+ ileal enterocytes in the S4 segment of jejunum expressed the sox17:GFP transgene (L and M) and Sox9 (N and O) at 0 hpt. (P–S) The sox17+ (P) and sox9+ (R) cells expressed PCNA. Graphs show ratio of PCNA+ cells among the sox17+ (Q) and sox9+ (S) cells. Data are presented as mean ± SEM. ∗∗∗∗p < 0.0001, two-tailed unpaired t test. Scale bars, 50 μm. See also Figure S7. |

The IL1β-NFκB axis is activated in the migrated ileal enterocytes to promote transdifferentiation (A and B) At 0 hpt, in contrast to the uninjured control, the expression of il1b (A) and the activity of NF-κB (B) became activated in the migrated ileal enterocytes, as exhibited by FISH and NFKB:GFP reporter transgene, respectively. (C–H) In contrast to Tg(fabp2:DenNTR; fabp6:dsRed) transgenic larvae injured by MTZ, the il1b mutation or treatment with JSH-23 was ineffective in the anterior migration of the DsRed+ ileal enterocytes at 0 hpt (C and F) but exhibited defective transdifferentiation into the Dendra2+ jejunal enterocytes at 48 hpt (D and G). Graphs show quantification of ratio of Dendra2+ among DsRed+ enterocytes in jejunum for il1b mutant (E) and JSH-23 treatment (H). Data are presented as mean ± SEM. ∗∗∗∗p < 0.0001, two-tailed unpaired t test. (I) Treatment with ceruletide, an agonist of NF-κB, promoted the transdifferentiation from migrated ileal enterocytes to the jejunal enterocytes at 16 hpt (MTZ, n = 28; MTZ + ceruletide, n = 26). Scale bars, 50 μm. See also Figures S6 and S7. |