
- Title
-
UBAP2 plays a role in bone homeostasis through the regulation of osteoblastogenesis and osteoclastogenesis
- Authors
- Kim, J., Kim, B.Y., Lee, J.S., Jeong, Y.M., Cho, H.J., Park, E., Kim, D., Kim, S.S., Kim, B.T., Choi, Y.J., Won, Y.Y., Jin, H.S., Chung, Y.S., Jeong, S.Y.
- Source
- Full text @ Nat. Commun.
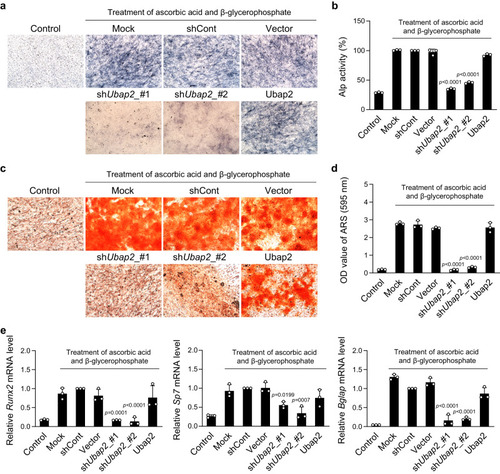
a, b Results of alkaline phosphatase (ALP) staining and ALP activity assay in Ubap2-knockdown and -overexpressing cells after 5 days with induction of osteoblast differentiation (n = 3 independent experiments; duplicate samples). c, d Results of mineralized nodule formation in Ubap2-knockdown and -overexpressing cells via Alizarin red S (ARS) staining and quantification of ARS-positive cells. Cells were incubated with the osteoblastic medium containing ascorbic acid and β-glycerophosphate for 14 days (n = 3 independent experiments; duplicate samples). e mRNA expression levels of osteoblast differentiation-related genes in Ubap2-knockdown and Ubap2-overexpressing cells. Quantitative reverse-transcription PCR was performed with the specific primers for Runx2, Sp7, and Bglap. Relative quantification of mRNA expression was presented as fold change relative to shCont (Day 5) and normalized to mouse Gusb expression (n = 3 independent experiments; duplicate samples). Control, no induction; Mock, no treatment; shCont, pLKO.1-puro empty vector; and Vector, pDON-5 Neo vector. Statistical differences of multiple groups were determined using one-way analysis of variance (ANOVA), followed by Tukey’s honestly significant difference post hoc test. Exact p-values representing comparison to short hairpin RNA control (shCont) are shown. All data are presented as mean ± SD with individual average values. Source data are provided as a Source Data file. |
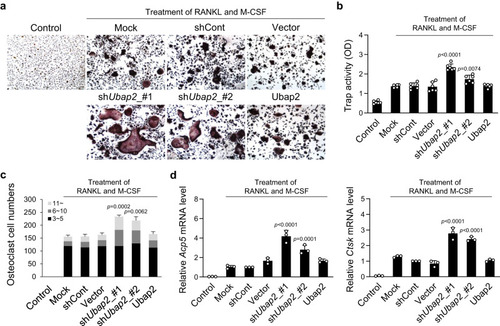
a, b Results of tartrate-resistant acid-phosphatase (TRAP) staining and TRAP activity assay in Ubap2-knockdown and -overexpressing monocytes. Monocytes from mouse bone marrow were incubated for 4 days after induction of osteoclast differentiation (n = 3 independent experiments; duplicate samples). c The distribution of multinuclear cells. Cells were categorized according to the number of nuclei; 3 ~ 5, 6 ~ 10, and more than 11. Multinuclear cells were counted and plotted. d mRNA expression levels of osteoclast differentiation-related genes in Ubap2-knockdown and -overexpressing cells. Quantitative reverse-transcription PCR was performed with the specific primers for Acp5 and Ctsk. Relative quantification of mRNA expression was presented as fold change relative to shCont (Day 4) and normalized to mouse Gusb expression (n = 3 independent experiments; duplicate samples). Control, no induction; Mock, no treatment; shCont, pLKO.1-puro empty vector; and Vector, pDON-5 Neo vector. Statistical differences of multiple groups were determined using one-way ANOVA, followed by Tukey’s honestly significant difference post hoc test. Exact p-values representing comparison to short hairpin RNA control (shCont) are shown. All data are presented as mean ± SD. Source data are provided as a Source Data file. |
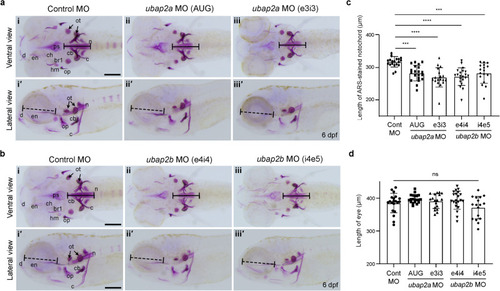
a Alizarin red S (ARS) staining results of the knockdown larvae with control morpholino (Control MO, n = 20) (i, iʹ), ubap2a MO (AUG, n = 20) (ii, iiʹ), ubap2a MO (e3i3, n = 18) (iii, iiiʹ). b ARS staining results of knockdown larvae with control morpholino (Control MO, n = 20) (i, iʹ), ubap2b MO (e4i4, n = 21) (ii, iiʹ), and ubap2b MO (i4e5, n = 17) (iii, iiiʹ). Upper panels show the ventral view and lower panels show the lateral view in (a) and (b). The larvae injected with either control MO, ubap2a, or ubap2b were stained with ARS at 6 dpf and the length of the ARS-stained notochord (black lines, the lengths of the lines in each panel are identical) was measured in a and b. Eye sizes (dashed black lines) of the larvae were also measured. Concentrations of Mos; 800 μM for control MO, 500 μM for ubap2a AUG MO, 300 μM for ubap2a e3i3 MO, 800 μM for ubap2b e4i4 MO, and 800 μM for ubap2b i4e5 MO. c, d Quantification results of the ARS-stained notochord length (c) and eye diameter (d). Statistical significances were determined by ordinary one-way ANOVA with Tukey’s test. ***p < 0.001 (Cont MO vs. ubap2a MO AUG, p = 0.0005; Cont MO vs. ubap2b MO i4e5, p = 0.0009 for (c)); **** |
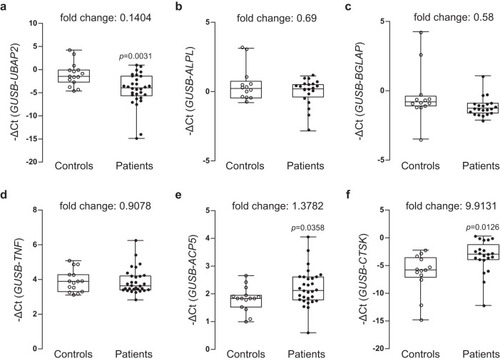
Relative mRNA expression and fold changes in the expression of aUBAP2, osteoblast differentiation markers bALPL, cBGLAP, dTNF, eACP5, and fCTSK in bone marrow-derived buffy coats from controls and patients with osteoporosis are shown. Total RNAs were isolated from buffy coat of bone marrow samples from the normal postmenopausal woman controls (n = 15) and postmenopausal women with osteoporosis (n = 30) and then used as templates to synthesize cDNAs. Relative mRNA expression of the six genes relative to the internal control GUSB was determined via quantitative reverse-transcription PCR. The negative values of the delta cycle threshold (–ΔCt) for UBAP2 are plotted via open and closed circles. The minimum to maximum values and median values are shown in box-and-whisker plots. All experiments were repeated three times with duplicated samples. Exact p-values between the groups were calculated with an unpaired two-tailed Student’s t-test. Source data are provided as a Source Data file. |
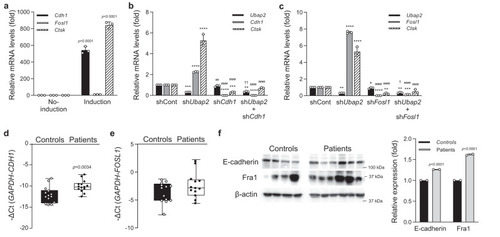
a mRNA expression levels of Cdh1, Fosl1, and Ctsk during osteoclast differentiation of primary cultured monocytes. Quantitative reverse-transcription PCR (qRT-PCR) was performed with the specific primers for Cdh1, Fosl1, and Ctsk. Relative mRNA expression was presented as fold change relative to No-induction and normalized to mouse Gapdh expression (n = 3 independent experiments; duplicate samples). Exact p-values of an unpaired two-tailed t-test are shown. b, c mRNA expression levels of target genes in the Ubap2, Cdh1 (shCdh1_#3), and Fosl1 (shFosl1_#3)-knockdown osteoclastogenesis-induced primary-cultured monocytes. qRT-PCR was performed as shown a (n = 3 independent experiments; duplicate samples). Statistical differences of multiple groups were determined using two-way ANOVA multiple comparisons. All data are presented as the mean ± SD. **p = 0.0012 vs. shCont; ***p = 0.0005 and p = 0.0004 vs. shCont; ****p < 0.0001 vs. shCont; ##, p = 0.0035 vs. shUbap2; ####, p < 0.0001 vs. shUbap2; and ††, p = 0.0079 vs. shCdh1 for (b); **, p = 0.0040, p = 0.0012, and p = 0.0081 vs. shCont; ***p = 0.0002 vs. shCont; ****p < 0.0001 vs. shCont; #, p = 0.0199 vs. shUbap2; ####, p < 0.0001 vs. shUbap2; and †, p = 0.0386 vs. shFosl1 for (c). d, e mRNA expression levels of CDH1 and FOSL1 in bone marrow-derived buffy coats from the normal postmenopausal woman controls (n = 15) and postmenopausal women with osteoporosis (n = 15). The minimum to maximum values and median values are shown in box and whisker plots. Exact p-values of an unpaired two-tailed t-test are shown. f Protein expression levels of E-cadherin and Fra1 in bone marrow-derived buffy coats from controls and patients with osteoporosis. The protein levels of E-cadherin, Fra1, and β-actin were analyzed by western blotting. The intensity for quantitative analysis was normalized to β-actin using Image Processing and Analysis in Java (Image J) software [http://imagej.nih.gov/ij/]. Source data are provided as a Source Data file. |
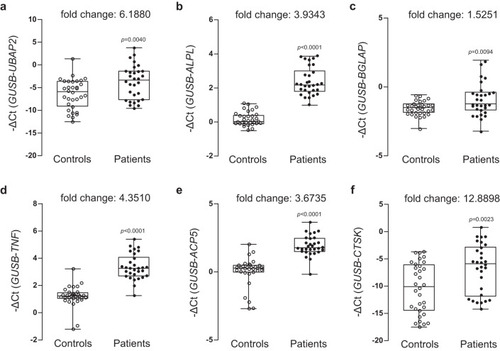
Relative mRNA expression and fold changes in expression of aUBAP2, osteoblast differentiation markers bALPL and cBGLAP, and osteoblast differentiation markers dTNF, eACP5, and fCTSK between whole blood-derived buffy coats from normal controls and patients with osteoporosis are shown. Total RNAs were isolated from buffy coat of peripheral blood samples from normal control postmenopausal women (n = 32) and postmenopausal women with osteoporosis (n = 31) and then used as templates to synthesize cDNAs. Relative mRNA expression of the six genes relative to the internal control GUSB was determined by quantitative reveres-transcription PCR. The negative values of delta cycle threshold (–ΔCt) for UBAP2 are plotted by opened and closed circles. The minimum to maximum values and median values are shown in box-and-whisker plots. All experiments were repeated three times with duplicated samples. Exact p-values between the groups were calculated with an unpaired two-tailed Student’s t-test. Source data are provided as a Source Data file. |
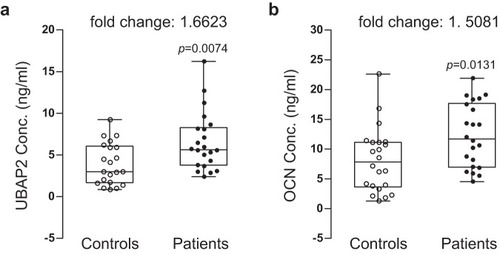
Protein concentration and fold changes in aUBAP2 and osteoblast differentiation marker b OCN between blood plasmas from normal controls and patients with osteoporosis are shown. Blood plasmas were separated from whole peripheral blood samples from the normal control postmenopausal women (n = 21) and postmenopausal women with osteoporosis (n = 22). Protein concentrations (ng/ml) in plasmas were determined by analysis of enzyme-linked immunosorbent assay data. The concentrations were plotted by opened and closed circles. The minimum to maximum concentration and median values are shown in box-and-whisker plots. Fold changes in mean values between groups are indicated. All experiments were repeated three times with duplicated samples. Exact p-values between the groups were calculated with an unpaired two-tailed Student’s t-test. Source data are provided as a Source Data file. |