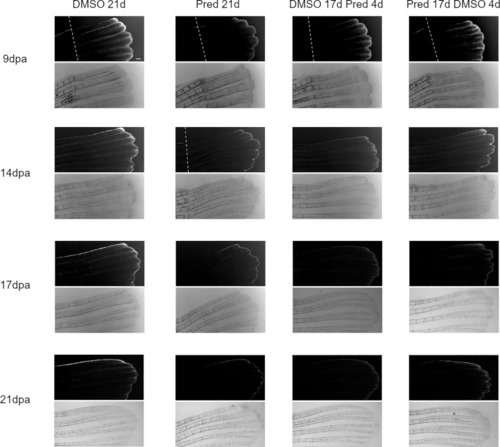
Quantification of fin regenerate length during the course of regeneration. Bars represent mean ± SD of fin outgrowth after amputation under different treatment conditions, measured at different times post amputation. Each dot represents one biological replicate. Parametric testing because of normal distribution of data. Statistical significance at 9 dpa, 14, dpa and 17 dpa was tested by two-tailed t-tests and at 21 dpa by post-hoc Dunnett’s multiple comparison after one-way ANOVA. n (DMSO,9dpa) = 13 (10 females, 3 males), n (Pred,9dpa) = 16 (12 females, 4 males), n (DMSO,14dpa) = 13 (10 females, 3 males), n (Pred,14dpa) = 14 (12 females, 2 males), n (DMSO,17dpa) = 12 (10 females, 2 males), n (Pred,17dpa) = 13 (12 females, 1 male), n (DMSO 21d,21dpa) = 5 (4 females, 1 male), n (Pred 21d,21dpa) = 6 (6 females), n (DMSO 17d Pred 4d,21dpa) = 7 (6 females, 1 male), n (Pred 17d DMSO 4d,21dpa) = 7 (6 females, 1 male).

Quantification of the 7xTCF-Xia.Siam:nlsmCherry Wnt reporter expression in the fin regenerate. Lines represent mean ± SEM of mCherry signal intensity for the four different treatments measured at 9 dpa, 14 dpa, 17 dpa, and 21 dpa. Signal was measured from the tip towards the amputation plane. Boxes indicate “Wnt-active zone” at 9 dpa, defined as levels beyond baseline expression levels detected at 21 dpa (i.e. point of intersection of 9 dpa curve with 21 dpa curve). n (DMSO 21d,9/14/17/21dpa) = 5 (4 females, 1 male); n (Pred 21d,9dpa) = 8 (6 females, 2 males), n (Pred 21d,14dpa) = 7 (6 females, 1 male), n (Pred 21d,17/21dpa) = 6 (6 females); n (DMSO 17d Pred 4d,9/14dpa) = 8 (6 females, 2 males), n (DMSO 17d Pred 4d,17/21dpa) = 7 (6 females, 1 male); n (Pred 17d DMSO 4d,9dpa) = 8 (6 females, 2 males), n (Pred 17d DMSO 4d,14/17/21dpa) = 7 (6 females, 1 male).

Images of the mCherry-fluorescent Wnt-active zone in zebrafish fin regenerates. The 7xTCF-Xia.Siam:nlsmCherry expression is detectable due to mCherry fluorescence (upper rows). Corresponding brightfield images are shown below. Within one treatment group, the same individual is shown across time points. From left to right: fish underwent 21 days of DMSO, 21 days of prednisolone, 17 days of DMSO followed by 4 days of prednisolone and 17 days of prednisolone followed by 4 days of DMSO treatment. Scalebar 200 µm. The white dotted lines indicate amputation planes in the fluorescence view of the fins. n (DMSO 21d,9/14/17/21dpa) = 5 (4 females, 1 male); n (Pred 21d,9dpa) = 8 (6 females, 2 males), n (Pred 21d,14dpa) = 7 (6 females, 1 male), n (Pred 21d,17/21dpa) = 6 (6 females); n (DMSO 17d Pred 4d,9/14dpa) = 8 (6 females, 2 males), n (DMSO 17d Pred 4d,17/21dpa) = 7 (6 females, 1 male); n (Pred 17d DMSO 4d,9dpa) = 8 (6 females, 2 males), n (Pred 17d DMSO 4d,14/17/21dpa) = 7 (6 females, 1 male).

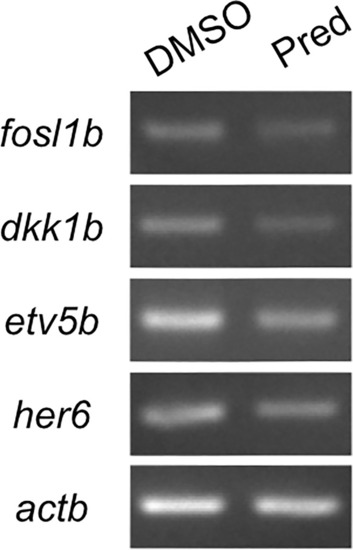
RT-PCR on Wnt, Fgf and Notch target genes and the Wnt signaling inhibitor dkk1b. 7-day prednisolone treatment after fin amputation reveals suppression of fosl1b (Wnt target gene), etv5b (ETS variant transcription factor 5b, Fgf target gene) and her6 (hairy-related 6, Notch target gene) in fin regenerates. Likewise, dkk1b levels are reduced.

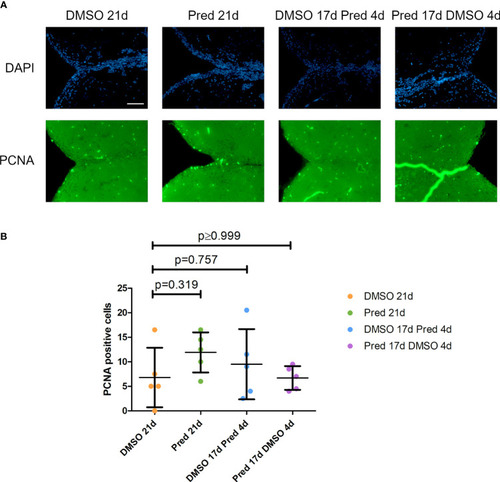
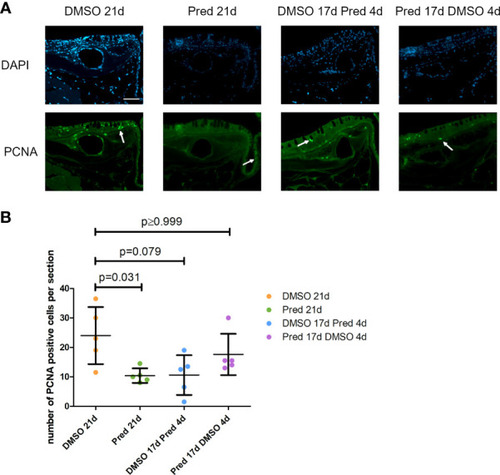
Quantification of PCNA positive cells along the skull bone of the zebrafish. (A) Total number of PCNA+ cells lining the skull bone. (B) Percentage of PCNA+ cells lining the skull bone (normalized to all cells lining the skull bone). Data are mean ± SD of PCNA positive cells lining bone in the different groups (21 days of DMSO, 21 days of prednisolone, 17 days of DMSO followed by 4 days of prednisolone and 17 days of prednisolone followed by 4 days of DMSO treatment). Each dot represents one biological replicate. Non-parametric testing because of non-normal distribution of the data. Statistical significance was tested by post-hoc Dunn’s multiple comparison after Kruskal-Wallis test. n=5 (4 females, 1 male in DMSO 21d, DMSO 17d Pred 4d, Pred 17 d DMSO 4d; 5 females in Pred 21d) in all groups with 1 section per individual.

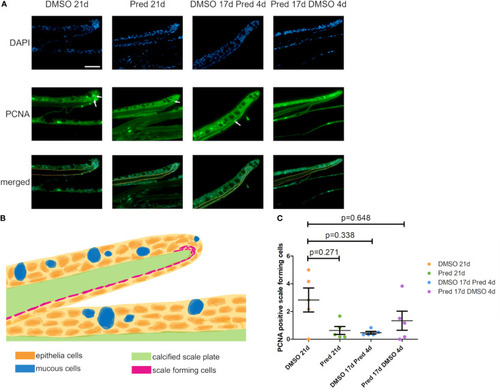
Proliferation of scale forming cells after treatment. (A) Immunohistochemical staining against PCNA and nuclear counterstain with DAPI. From left to right: fish underwent 21 days of DMSO, 21 days of prednisolone, 17 days of DMSO followed by 4 days of prednisolone and 17 days of prednisolone followed by 4 days of DMSO treatment. Scalebar 50 µm. White arrows indicate some PCNA+ cells. Yellow dotted lines outline the calcified scale plate together with the scale forming cells. (B) Schematic section view of a zebrafish scale in the zebrafish trunk. The calcified scale plate (green) is enclosed by the skin epithelium containing layers of epithelial (orange) and mucous cells (blue). The scale-forming cells (magenta) are in close proximity to the calcified scale plate. They cover the lower side of the scale and are located in higher number at the scale tip (in the marginal zone). (C) Quantification of PCNA+ scale forming cells in the different groups (21 days of DMSO, 21 days of prednisolone, 17 days of DMSO followed by 4 days of prednisolone and 17 days of prednisolone followed by 4 days of DMSO treatment). Data are mean ± SD of PCNA+ scale forming cells. Each dot represents one biological replicate. Non-parametric testing because of non-normal distribution of the data. Statistical significance was tested by post-hoc Dunn’s multiple comparison after Kruskal-Wallis test. n=5 (4 females, 1 male in DMSO 21d, DMSO 17d Pred 4d, Pred 17 d DMSO 4d; 5 females in Pred 21d) in all groups with 1 section per individual.

Cell proliferation in the telencephalon of zebrafish. (A) Immunohistochemical staining against PCNA and nuclear counterstain with DAPI. From left to right: fish underwent 21 days of DMSO, 21 days of prednisolone, 17 days of DMSO followed by 4 days of prednisolone and 17 days of prednisolone followed by 4 days of DMSO treatment. Scalebar 50 µm. (B) Quantification of PCNA+ cells in the telencephalon. Data are mean ± SD of PCNA+ cells in the different groups (21 days of DMSO, 21 days of prednisolone, 17 days of DMSO followed by 4 days of prednisolone and 17 days of prednisolone followed by 4 days of DMSO. Each dot represents one biological replicate. Parametric testing because of normal distribution of the data. Statistical significance was tested by post-hoc Dunnett’s multiple comparison after one-way ANOVA. n=5 (4 females, 1 male in DMSO 21d, DMSO 17d Pred 4d, Pred 17 d DMSO 4d; 5 females in Pred 21d) in all groups with 2 sections per individual.

Wnt signaling in the skin of zebrafish. (A) Immunohistochemical staining against the Wnt-reporter mCherry and nuclear counterstain with DAPI. From left to right: fish underwent 21 days of DMSO, 21 days of prednisolone, 17 days of DMSO followed by 4 days of prednisolone and 17 days of prednisolone followed by 4 days of DMSO treatment. Scalebar 50 µm. (B) Quantification of the 7xTCF-Xia.Siam:nlsmCherry Wnt reporter expression in the skin. Lines represent mean ± SEM of mCherry signal intensity for fish that underwent 21 days of DMSO, 21 days prednisolone, 17 days DMSO followed by 4 days prednisolone and 17 days of prednisolone followed by 4 days of DMSO treatment. Signal was measured from the outermost layer towards the inner layers of the skin. Average skin thickness is around 50 µm. n=5 (4 females, 1 male in DMSO 21d, DMSO 17d Pred 4d, Pred 17 d DMSO 4d; 5 females in Pred 21d) in all groups with 2 sections per individual.

Dkk1 expression in the skin of zebrafish. Immunohistochemical staining against Dkk1 and nuclear counterstain with DAPI in zebrafish that underwent 21 days of DMSO or 21 days of prednisolone treatment. 4 out of 5 zebrafish with prednisolone treatment showed stronger staining in the basal portion of skin than DMSO treated zebrafish (4 out of 5 DMSO treated zebrafish with weak staining in the basal portion of the skin). Scale bar 50 µm. Arrows point to brighter signal in the basal portion of the skin. Asterisks indicate mucous cells. n=5 (4 females, 1 male in DMSO 21d, 5 females in Pred 21d) in both groups with 5 sections per individual.

Cell proliferation in the skin of zebrafish. (A) Immunohistochemical staining against PCNA and nuclear counterstain with DAPI. From left to right: fish underwent 21 days of DMSO, 21 days of prednisolone, 17 days of DMSO followed by 4 days of prednisolone and 17 days of prednisolone followed by 4 days of DMSO treatment. Scalebar 50 µm. White arrows indicate PCNA+ cells. (B) Quantification of PCNA+ cells in the skin. Data are mean ± SD of PCNA+ cells per section for the treatment conditions 21 days of DMSO, 21 days of prednisolone, 17 days of DMSO followed by 4 days of prednisolone and 17 days of prednisolone followed by 4 days of DMSO. Each dot represents one biological replicate. Non-parametric testing because of non-normal distribution of the data. Statistical significance was tested by post-hoc Dunn’s multiple comparison after Kruskal-Wallis test. n=5 (4 females, 1 male in DMSO 21d, DMSO 17d Pred 4d, Pred 17 d DMSO 4d; 5 females in Pred 21d) in all groups with 2 sections per individual.

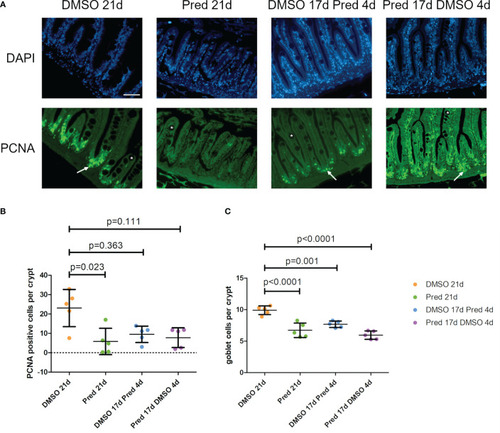
Cell proliferation and goblet cell number in the crypts of the intestine. (A) Immunohistochemical staining against PCNA and nuclear counterstain with DAPI. From left to right: fish underwent 21 days of DMSO, 21 days of prednisolone, 17 days of DMSO followed by 4 days of prednisolone and 17 days of prednisolone followed by 4 days of DMSO treatment. White asterisks indicate goblet cells and white arrows indicate PCNA+ cells in the crypts. Scalebar 50 µm. Sample “Pred 17d DMSO 4d” showed increased autofluorescence. (B) Quantification of PCNA+ cells per crypt in the intestine. Data are mean ± SD of PCNA+ cells per crypt for the treatment conditions 21 days of DMSO, 21 days of prednisolone, 17 days of DMSO followed by 4 days of prednisolone and 17 days of prednisolone followed by 4 days of DMSO. Each dot represents one biological replicate. Non-parametric testing because of non-normal distribution of the data. Statistical significance was tested by post-hoc Dunn’s multiple comparison after Kruskal-Wallis test. n=5 (4 females, 1 male in DMSO 21d, DMSO 17d Pred 4d, Pred 17 d DMSO 4d; 5 females in Pred 21d) in all groups with 3 sections per individual. (C) Quantification of goblet cells per intestinal crypt. Data are mean ± SD of goblet cells per crypt for the treatment conditions 21 days of DMSO, 21 days of prednisolone, 17 days of DMSO followed by 4 days of prednisolone and 17 days of prednisolone followed by 4 days of DMSO. Each dot represents one biological replicate. Parametric testing because of normal distribution of the data. Statistical significance was tested by post-hoc Dunnett’s multiple comparison after one-way ANOVA. n=5 (4 females, 1 male in DMSO 21d, DMSO 17d Pred 4d, Pred 17 d DMSO 4d; 5 females in Pred 21d) in all groups with 8 sections per individual.

Absence of mCherry specific staining in Wnt-reporter 7xTCF-Xia.Siam:nlsmCherry zebrafish intestine. Immunohistochemical staining against the Wnt-reporter mCherry and nuclear counterstain with DAPI. From left to right: fish underwent 21 days of DMSO, 21 days of prednisolone, 17 days of DMSO followed by 4 days of prednisolone and 17 days of prednisolone followed 4 days of DMSO treatment. With our staining method, we were unable to detect mCherry+ cells in the intestine of transgenic reporter zebrafish. Scalebar 50 µm. n=5 (4 females, 1 male in DMSO 21d, DMSO 17d Pred 4d, Pred 17 d DMSO 4d; 5 females in Pred 21d) in all groups with 3 sections per individual.

Leukocytes in the zebrafish intestine. (A) Immunohistochemical staining against L-Plastin and nuclear counterstain with DAPI. From left to right: fish underwent 21 days of DMSO, 21 days of prednisolone, 17 days of DMSO followed by 4 days of prednisolone and 17 days of prednisolone followed by 4 days of DMSO treatment. Scalebar 50 µm. (B) Quantification of L-Plastin+ cells per crypt of the zebrafish intestine. Data are mean ± SD of L-Plastin+ cells in the 4 groups (21 days of DMSO, 21 days of prednisolone, 17 days of DMSO followed by 4 days of prednisolone and 17 days of prednisolone followed by 4 days of DMSO). Each dot represents one biological replicate. Parametric testing because of normal distribution of the data. Statistical significance was tested by post-hoc Dunnett’s multiple comparison after one-way ANOVA. n=5 (4 females, 1 male in DMSO 21d, DMSO 17d Pred 4d, Pred 17 d DMSO 4d; 5 females in Pred 21d) in all groups with 5 sections per individual.

Acknowledgments
This image is the copyrighted work of the attributed author or publisher, and ZFIN has permission only to display this image to its users. Additional permissions should be obtained from the applicable author or publisher of the image. Full text @ Front Endocrinol (Lausanne)