
- Title
-
Antisense Oligonucleotide Activation via Enzymatic Antibiotic Resistance Mechanism
- Authors
- Darrah, K.E., Albright, S., Kumbhare, R., Tsang, M., Chen, J.K., Deiters, A.
- Source
- Full text @ ACS Chem. Biol.

Following enzyme-mediated hydrolysis of the β-lactam ring by β-lactamase (PDB ID 4F6H), the resulting amine intermediate undergoes self-immolation. The release of the 5′-end generates the active, linearized MO capable of hybridizing to its respective target mRNA and silencing gene expression. |
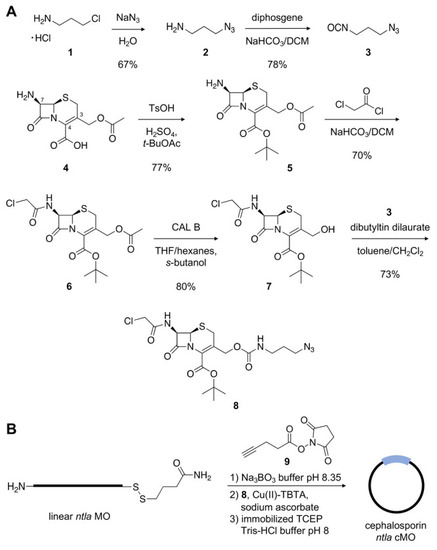
(A) Synthetic scheme of the cephalosporin-containing linker |

(A) Luciferase reporter assay in which luciferase expression is silenced in the presence of linearized MO. (B) Luminescence signal after treatment of the indicated MO. Data represent average ± SEM from three independent experiments. (C) Gel-shift assay showing activation of the circular morpholino sequestering its complementary target DNA (cDNA) in the presence of β-lactamase. (D) Quantification of a time course analysis of cyclic cephalosporin ntla cMO cleavage following incubation with recombinant β-lactamase. Bars represent averages and error bars represent standard deviations from three independent experiments. |

(A) Structure of the chromogenic β-lactamase substrate nitrocefin (10), which is hydrolyzed to 11 following β-lactamase catalysis. (B) Western blot analysis of β-lactamase expression in embryos injected with 400 pg of mRNA. (C) Zebrafish lysates analyzed for β-lactamase activity by monitoring production of 11 (absorbance at 486 nm) over time. (D) Initial velocities were determined through a linear regression analysis of the first 10 min of the data presented in (C). The error values indicate the standard deviation of values for the best fit parameters from the linear regression analysis.(A) Structure of the chromogenic β-lactamase substrate nitrocefin (10), which is hydrolyzed to 11 following β-lactamase catalysis. (B) Western blot analysis of β-lactamase expression in embryos injected with 400 pg of mRNA. (C) Zebrafish lysates analyzed for β-lactamase activity by monitoring production of 11 (absorbance at 486 nm) over time. (D) Initial velocities were determined through a linear regression analysis of the first 10 min of the data presented in (C). The error values indicate the standard deviation of values for the best fit parameters from the linear regression analysis. |

(A) Representative images of ntla morphant phenotypes in zebrafish embryos at 24 hpf. Scale bar equals 1 mm. (B) Phenotypic scoring of embryos injected with the indicated morpholino and amount of β-lactamase mRNA. |