FIGURE SUMMARY
Title

Plasticity of dopaminergic phenotype and locomotion in larval zebrafish induced by brain excitability changes during the embryonic period

Authors
Bataille, S., Jalaber, H., Colin, I., Remy, D., Affaticati, P., Froc, C., Levraud, J.P., Vernier, P., Demarque, M.
Source
Full text @ eNeuro

Timing of the experiments, characterization of forebrain calcium transients and their modification by bath application of pharmacological treatments. A, Timeline of the experiments. Pharmacological treatments and calcium imaging experiments were performed from 2 to 3 dpf (embryonic period) and the immunohistochemistry and behavior experiments were performed several days later, at 6–7 dpf (larval period). B, Left panel, Schematic ventral view of a zebrafish brain, showing the approximate region for calcium recordings. Right panel, Confocal image from a time-lapse recording of the brain of 48 hpf of Et(hsp:gal4;UAS:GCamp6f) embryos in control conditions. Fluorescence is displayed on a pseudocolor scale, the lookup table coding for the intensity scale is shown in the bottom-right corner of the image. Scale bar = 100 μm. White dash-circle defines an example region of interest corresponding to the cell body of a cell which changes in fluorescence are displayed in C. C, Representative changes in fluorescence intensity plotted as a function of time in different experimental conditions: control conditions in blue, following veratridine treatment (10 μm) in green, and following TCNF treatment (TTX, 2.5 μm; ω-conotoxin, 0.1 μm; nifedipine, 0.5 μm and flunarizine, 2.5 μm) in red. Ca2+ transients were scored as changes in fluorescence more than two times higher than the SD of the baseline (dashed lines), and >3 s in duration, calculated as the width at half-maximum. D–O, Boxplots showing different parameters of calcium spikes in control conditions (blue), following 10 μm veratridine treatment (green) and following TCNF treatment (red). D–G, Results obtained in the Hsp:gal4 line from five independent experiments. H–K, Results obtained in the TBP:gal4 line, from six independent experiments. L–O, Results obtained in the HuC:gal4 line, from three independent experiments. D, Average incidence of the recorded Ca2+ transients, BFW ANOVA, 15 < n < 21 fields of view. E, Average frequency, KW test, 291 < n < 535 values. F, Average normalized amplitude of the recorded Ca2+ transients, KW test, 1258 < n < 4809 transients. G, Average duration of the Ca2+ transients, KW test, 1258 < n < 4809 transients. H, Average incidence of the recorded Ca2+ transients, BFW ANOVA, 13 < n < 17 fields of view. I, Average frequency, KW test, 148 < n < 281 values. J, Average normalized amplitude of the recorded Ca2+ transients, KW test, 607 < n < 2980 transients. K, Average duration of the Ca2+ transients, KW test, 607 < n < 2980 transients. L, Average incidence of the recorded Ca2+ transients, BFW ANOVA, 7 < n < 15 fields of view. M, Average frequency, KW test, 507 < n < 527 values. N, Average normalized amplitude of the recorded Ca2+ transients, KW test, 2442 < n < 5149 transients. O, Average duration of the Ca2+ transients, KW test, 2442 < n < 5149 transients. *p < 0.05, **p < 0.01, ***p < 0.001, ****p < 0.001, ns = non significant.

Effects of ENE on the expression of dopaminergic markers in the zebrafish larval subpallium and olfactory bulb. A, Maximum projection of confocal z series of the brain of 6- to 7-dpf Tg(Et.vMAT2:eGFP) larvae, following ENE increase (left column, boxed in green), in control conditions (middle column, boxed in blue), and following ENE decrease (right column, boxed in red). Immunostaining to TH (magenta) and GFP (cyan) and DAPI (yellow) are shown as composite image (top) as well as for each color channels. Scale bars = 50 μm. B–E, Boxplots showing the number of cells IR+ for dopaminergic markers in the SP (B) and the OB (D) from six independent experiments, in control conditions (blue), following ENE increase (green) and following ENE decrease (red). B, Left, Number of SP-vMAT2+ cells, KW test, 6 < n < 16. Right, Number of SP-TH+ cells, KW test, 34 < n < 49. C, Proportion of vMAT2+ cells being also TH1+ in the SP, ANOVA test, n = 24. D, Left, Number of OB-vMAT2+ cells, KW test, 6 < n < 16. Right, OB-TH+ cells, KW test, 34 < n < 49. E, Proportion of vMAT2+ cells being also TH1+ in the SP, ANOVA test, n = 24. *p < 0.05, **p < 0.01, ns = non significant.

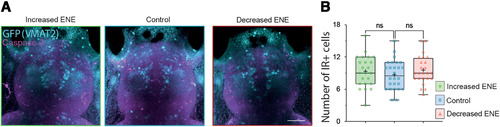
Absence of changes in programmed cell death following modifications of ENE. A, Maximum projection of confocal z series of the brain of 6- to 7-dpf Tg(Et.vMAT2:eGFP) larvae, following ENE increase (left image, boxed in green), in control conditions (middle image, boxed in blue), and following ENE decrease (right image, boxed in red). Immunostaining to caspase-3 (magenta) and GFP (cyan) are shown as merged channels. Scale bars = 50 μm. B, Boxplots showing the number of the caspase-3+ IR cells counted in the telencephalon following ENE increase (green), in control conditions (blue) and following ENE decrease (red). KW test, 23 < n < 26 telencephalon from four independent experiments. ns = non significant.

Effects of a 24-h bath applied treatments during embryonic development on spontaneous swimming of zebrafish larvae. A, Representative path reconstructions for 24 individual larvae during a 10-min trial for three experimental conditions. We performed the experiments at 6–7 dpf when the properties of swimming episodes are relatively stable in control conditions. The portion of the path corresponding to cruises episodes are shown in green, and to bursts are shown in red. B–D, Boxplots showing the mean distance per larva following ENE increase (green), in control conditions (blue), and following ENE decrease (red). Distance is expressed as the cumulated length of the path covered. B, Distance covered when no threshold is applied for the analysis. C, Distance covered during cruises. D, Distance covered during bursts. For all boxplots the p of normality test for at least one condition was <0.05; therefore, KW test was used, 192 < n < 384. ****p < 0.001.

Washout kinetics of the pharmacological treatments in the larval and embryonic zebrafish brain. A, Boxplots showing the overall mean distance per larva from 5-dpf larvae, following acute application of veratridine (green), in control conditions (blue), following acute application of TCNF (red) and after 24–48 h of wash for each treatment (light boxplots). For all boxplots the p of normality test for at least one condition was >0.05, therefore KW test was used, 28 < n < 117 fish from three independent experiments. B, C, Boxplots showing parameters of Ca2+ transients in the telencephalon of 2-dpf embryos, following acute veratridine application (green), in control conditions (blue), following acute TCNF application (red) and following 6–10 h of wash for each treatment (light green and light red boxplots). B, Incidence of Ca2+ transients. BFW ANOVA test. C, Frequency of Ca2+ transients, KW test. 258 < n < 318 values from three independent experiments. *p < 0.05, **p < 0.01, ****p < 0.001, ns = non significant.

Acknowledgments
This image is the copyrighted work of the attributed author or publisher, and ZFIN has permission only to display this image to its users. Additional permissions should be obtained from the applicable author or publisher of the image. Full text @ eNeuro