FIGURE SUMMARY
Title

Acquisition of a large virulence plasmid (pINV) promoted temperature-dependent virulence and global dispersal of O96:H19 enteroinvasive Escherichia coli

Authors
Miles, S.L., Torraca, V., Dyson, Z.A., López-Jiménez, A.T., Foster-Nyarko, E., Lobato-Márquez, D., Jenkins, C., Holt, K.E., Mostowy, S.
Source
Full text @ MBio

Time-calibrated phylogeny of 92 Sequence Type (ST)99 genomes. BactDating was used to infer a time-calibrated phylogeny, incorporating the output from the recombination detection software, Gubbins. Blue diamonds indicate the internal nodes representing the most recent common ancestors (MRCA) of interest. Tip labels represent assembly barcodes correlating to the isolate accession in Enterobase. Tip labels in bold represent isolates that we tested in vivo. As determined using ShigEiFinder (20), the presence of the invasion plasmid (pINV) is indicated by a red box in the pINV column. We estimate the MRCA of the whole group to be ~1776 and the MRCA for the pINV+ cluster to be ~1982.

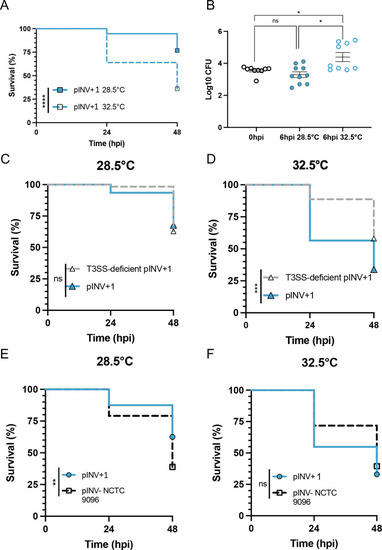
Temperature-dependent and -independent mechanisms of virulence in the ST99 group. Zebrafish larvae at 3 d post-fertilization were injected with 5,000 CFU of a representative pINV+ ST99 strain, a T3SS-deficient strain and an ancestral pINV− ST99 strain, before being separated for incubation at 28.5°C or 32.5°C. (A, B) pINV+1 strain exhibits a temperature-dependent virulence with significantly more killing observed at 32.5°C. Enumeration of bacterial burden is also temperature dependent, with greater CFUs quantified at 6 h post-infection from larvae incubated at 32.5°C. Black circles indicate pINV+1 CFUs at 0 hpi, blue filled circles indicate pINV+1 CFUs at 6 hpi incubated at 28.5°C, and blue outlined circles indicate pINV+1 CFUs at 6 hpi incubated at 32.5°C. (C, D) Thermoregulated virulence is lost in a T3SS-deficient (Congo red negative) pINV+1 strain (gray dashed line). (E, F) pINV− strain NCTC 9096 (black dashed line) is virulent in the zebrafish model in a non-temperature-dependent manner. Significance was tested using Log-rank (Mantel-Cox) test for survival curves. For CFUs (panel B), significance was tested using a one-way ANOVA with Sidak’s correction. *P < 0.0332; **P < 0.0021; ***P < 0.0002; and ****P < 0.0001.

Acknowledgments
This image is the copyrighted work of the attributed author or publisher, and ZFIN has permission only to display this image to its users. Additional permissions should be obtained from the applicable author or publisher of the image. Full text @ MBio