
- Title
-
Hiding in the yolk: A unique feature of Legionella pneumophila infection of zebrafish
- Authors
- Viana, F., Boucontet, L., Laghi, V., Schator, D., Ibranosyan, M., Jarraud, S., Colucci-Guyon, E., Buchrieser, C.
- Source
- Full text @ PLoS Pathog.
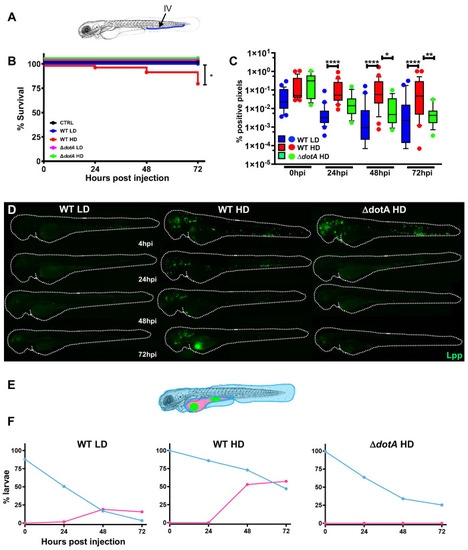
Zebrafish larvae are susceptible to intravenous L. pneumophila infection in a dose dependent manner.
A) Scheme of the experimental set up of bacterial infection using zebrafish. A 72hpf zebrafish larva. Bacteria are injected in the bloodstream (iv) via the caudal vein (green arrow). The scheme of the zebrafish larvae has been adapted from [35] and has been previously modified from [87] B) Survival curves (three independent experiments pooled) of zebrafish larvae injected with WT-GFP Low Dose (WT LD) (blue curve, n = 60) or High Dose (HD) (red curve, n = 60), or with ΔdotA-GFP Low Dose (ΔdotA LD) (green curve, n = 12) or High Dose (ΔdotA HD) (green curve, n = 36), and incubated at 28°C. Control non-injected fish (CTRL, black curve; n = 72). P < 0.05 was considered statistically significant (symbols: **** P < 0.0001; ***P < 0.001; **P < 0.01; *P < 0.05. C) Bacterial burden evaluation by quantification of % of fluorescent pixel counts from images of individual injected larvae followed over time from 0 to 72 hpi. Each larva was imaged daily, and images were analysed with Fiji for bacterial burden quantification. Five experiments have been pooled, for a total of 28 larvae for WT LD and LD, 18 for ΔdotA HD. P < 0.05 was considered statistically significant (symbols: **** P < 0.0001; ***P < 0.001; **P < 0.01; *P < 0.05. No symbol on graphs means that not statistically differences were observed. D) Representative images of L. pneumophila dissemination, determined by live imaging using a fluorescence stereomicroscope, of zebrafish AB larvae infected with a LD or a HD of WT-GFP, or a HD of ΔdotA-GFP. Individual infected larvae were followed over time by live imaging at 4h, 24h, 48h, and 72h post injection. GFP fluorescence of the injected bacteria is shown. E) Scheme of a 72 hpi larva with body (light blue) and yolk (pink) region highlighted. Green dot in the yolk represents bacteria burden. The scheme of the zebrafish larvae has been adapted from [35] and has been previously modified from [87]. F) Quantification of bacterial dissemination over time. Larvae injected with LD, HD LD or ΔdotA HD were imaged over time, and then scored for the GFP + bacteria absolute presence for each larva over time. Larvae were scored as “infected” when they showed at least one small detectable GFP+ dot. Data obtained were plotted as % of larvae with bacteria in the body (tail, trunk, head; blue curve), or in the yolk (pink curve). 11 independent experiments have been plotted (representing a total of n = 69 WT LD; n = 58 WT HD; n = 54 ΔdotA HD infected larvae). |
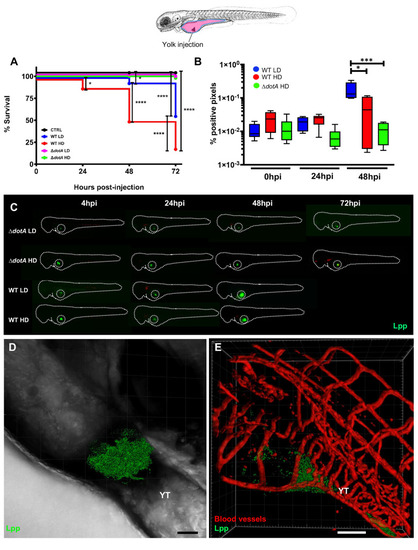
Bloodstream L. pneumophila establish a proliferative niche in the yolk causing a persistent local infection.
A) Survival curves (two independent experiments pooled) of zebrafish larvae injected into the yolk with WT-GFP Low Dose (WT LD) (blue curve, n = 48) or High Dose (HD) (red curve, n = 48), or with ΔdotA-GFP Low Dose (ΔdotA LD) (magenta curve, n = 48) or High Dose (ΔdotA HD) (green curve, n = 48), and incubated at 28°C. Non-injected fish (CTRL, black curve; n = 48). The scheme of the zebrafish larvae has been adapted from [35] and has been previously modified from [87]. B) Bacterial burden evaluation by quantification of % of fluorescent pixel counts on individual injected larvae followed over time by 0 to 48 hpi. Each larva was imaged daily, and images were analysed with Fiji for bacterial burden evaluation. One experiment plotted, 6 larvae per condition. P < 0.05 was considered statistically significant (symbols: **** P < 0.0001; ***P < 0.001; **P < 0.01; *P < 0.05. No symbol on graphs means that not statistically differences were observed). C) Representative images of L. pneumophila localization, determined by live imaging using a fluorescence stereomicroscope, of zebrafish larvae infected with a LD or a HD of WT-GFP, or a LD or a HD of ΔdotA-GFP. Individual infected larvae were followed over time by live imaging at 4h, 24h, 48h, and 72 hpi. GFP fluorescence of the injected bacteria is shown. Dotted circle highlights GFP bacteria in the yolk. D) Representative maximum intensity projection of confocal acquisition of a 72 hpi zebrafish larva injected in the bloodstream with HD of WT-GFP, mounted laterally and live imaged using high resolution confocal fluorescence microscope, showing bacteria growing in the yolk and yolk tube (YT) region. The x-y-z raw data were post treated with the LEICA lighting application for reducing noise and processed with Imaris for 3D volume rendering. Related to S1 Movie. E) Imaris 3D reconstruction and volume rendering of the L. pneumophila growth (GFP labelling) in the yolk of kdrl:ras-mCherry (red vessels) infected larva at 72hpi, showed laterally. Overlay of GFP and mCherry is shown; BF is shown to help to visualize the yolk region and host anatomy. YT Related to S2 Movie. Scale bar = 50mm. |

Characterization of the L. pneumophila foci growing in the yolk region of zebrafish larvae.
A) Scheme of 72hpf with body (light blue) and yolk region (pink) highlighted; the yolk sustaining L. pneumophila growing has been indicated with green dots. The scheme of the zebrafish larvae has been adapted from [35] and has been previously modified from [87]. B) Imaris 3D reconstruction and volume rendering of the L. pneumophila growth in the yolk of 72 hpi mfap4: mCherry larva (red macrophages) injected in the bloodstream with HD of WT-GFP at 72hpf, shown laterally. Inset shows the maximum intensity projection of the L. pneumophila foci of the same larva mounted ventrally. Scale bar = 20mm. Related to S3 Movie. C) Imaris 3D reconstruction and volume rendering of the L. pneumophila growth in the yolk of lyz:DsRed (red neutrophils) infected larva at 72 hpi, showed laterally. Scale bar = 20mm. Related to S4 Movie. D) Quantification of bacterial burden in the yolk over time. Larvae injected with LD, HD WT, or ΔdotA HD were imaged over time, and then scored for the GFP + bacteria absolute presence in the yolk for each larva over time. Larvae were scored as “infected” when they showed at least one small detectable GFP+ dot. Data obtained were plotted as % of larvae with bacteria in the in the yolk upon LD (blue curve), HD (red curve) WT or ΔdotA HD (green curve) injection over time. 11 independent experiments have been plotted (representing a total of n = 69 WT LD; n = 58 WT HD; n = 54 ΔdotA HD infected larvae) E) Time frame extracted from a 4D acquisition of L. pneumophila growth in the yolk between 48 and 72 hpi of mfap4: mCherry larva (red macrophages) injected in the bloodstream with HD of WT-GFP shown laterally. Imaris 4D reconstruction and volume rendering of the bacteria aggregate and interaction with macrophages. The yolk has been manually highlighted (in blue) with Imaris. Scale bar: 10. Related to S5 Movie. F) Quantification of bacterial burden in the whole body, in the body or in the yolk region versus macrophage or neutrophil quantification in the body or in the yolk region in HD WT-GFP infected larvae followed over time. Two independent experiments plotted for each phagocyte type (total of 11 larvae for macrophage and 11 larvae for neutrophil quantification). Quantification of the fluorescence images (GFP bacteria and RFP leukocytes) was done using CellProfiler software. P < 0.05 was considered statistically significant (symbols: **** P < 0.0001; ***P < 0.001; **P < 0.01; *P < 0.05). No symbol on graphs means that not statistically differences were observed. |

L. pneumophila high dose injection results in (systemic) macrophage and neutrophil death.
A) Macrophage counts of control larvae (black symbols) or upon Low Dose (blue symbols) or High Dose of WT-GFP (red symbols), or High Dose (green symbols) of ΔdotA -GFP injection. The scheme of the zebrafish larvae has been adapted from [35] and has been previously modified from [87]. Macrophages were counted manually from images taken on live infected larvae over time from T0 to T72 hpi, using ImageJ software, and results were plotted using GraphPad Prism software. Mean±SEM are also shown (horizontal bars). Data plotted are from two pooled independent experiments (n = 12 larvae scored for each condition). P < 0.05 was considered statistically significant (symbols: **** P < 0.0001; ***P < 0.001; **P < 0.01; *P < 0.05). No symbol on graphs means that not statistically differences were observed. B) Frames extracted from maximum intensity projection of in vivo time-lapse confocal fluorescence microscopy of 72hpf Tg(mfap4::mCherryF) larvae injected in the bloodstream (iv) with a LD, HD (of WT-GFP or a HD of ΔdotA-GFP (upper panel) or Tg(LysC::DsRed)nz50 in the bloodstream with a LD, HD of WT-GFP or a HD of ΔdotA-GFP (lower panel) to follow macrophage bacteria interaction over time during the first 16 hpi. Overlay of green (L. pneumophila) and red (leucocytes) fluorescence of the caudal area of the larvae (region boxed in the scheme on the right of the panel) is shown. BF helps for anatomical region indication. Representative of n = 12 to 16 injected larvae for each condition. Scale bar: 50μm. See also related S6 Movie. C) macrophage L pneumophila interaction at 72 hpi captured at high resolution upon HD WT injection. Bacteria inside zebrafish macrophages suggesting the establishment of a replicative niche (arrows), as documented for cultured mammalian macrophages or amoebae. Representative of n = 15 scored infected larvae. Overlay of green (GFP bacteria), red (mCherry macrophages) and BF is shown. Scale bar = 10mm. |
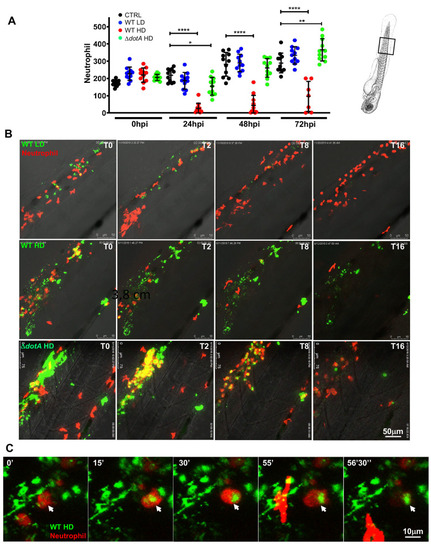
L. pneumophila interaction with neutrophils and neutrophil counts upon bloodstream injection of LD, HD WT GFP or HD ΔdotA L. pneumophila.
A) Neutrophil counts from control larvae (CTRL, black symbols) or Low Dose or High Dose of WT-GFP (blue or red symbols), or High Dose of ΔdotA-GFP (green symbols) injected larvae. The scheme of the zebrafish larvae has been adapted from [35] and has been previously modified from [87]. Data plotted in the same way as for macrophage counts in Fig 4. Two pooled independent experiments (n = 10 larvae scored for each condition). P < 0.05 was considered statistically significant (symbols: **** P < 0.0001; ***P < 0.001; **P < 0.01; *P < 0.05). No symbol on graphs means that not statistically differences were observed. B) Frames extracted from maximum intensity projection of in vivo time-lapse confocal fluorescence microscopy of 72hpf Tg(LysC::DsRed)nz50 in the bloodstream (iv) with a LD, HD of WT-GFP or a HD of ΔdotA-GFP (lower panel) to follow neutrophil interaction with L. pneumophila immediately upon injection for 16 hpi. Images were taken from time lapse at different time points (0 hpi, 2 hpi, 4 hpi, 8 hpi and 16 hpi). Overlay of green (L. pneumophila) and red (neutrophils) fluorescence of the caudal area of the larvae (region boxed in the scheme on the right of the panel) is shown. Data representative of n = 12 to 16 larvae scored. Scale bar: 50μm. See also related S7 Movie. C) Details of a dying phagocytosing neutrophil, progressively rounding-up and loosing fluorescence upon HD WT injection. Arrowheads point to the dying phagocytosing neutrophils. Representatives of n = 14 larvae scored. Scale bar = 10mm. See also related S8 Movie. |
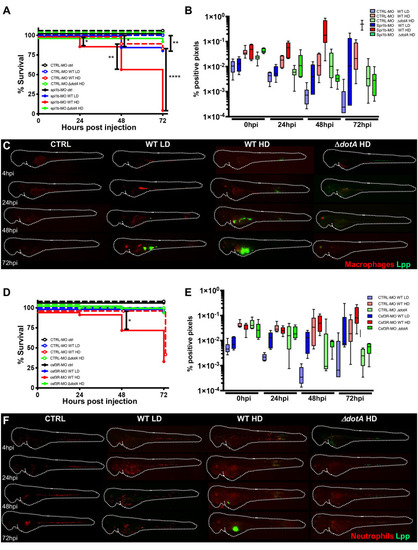
Macrophages are crucial to restrict Legionella pneumophila dissemination.
A) Survival curves of CTRL morphant zebrafish larvae injected with a Low Dose (LD) (blue dashed curve, n = 34 larvae) or a High Dose (HD) (red dashed curve, n = 34) of WT-GFP, or with a HD (green dashed curve, n = 24) of ΔdotA -GFP, and spi1b morphant zebrafish larvae injected with a LD (blue curve, n = 48) or a HD (red curve, n = 48) of WT-GFP, or with a High Dose (HD) (green curve, n = 48) of ΔdotA -GFP. Non-injected CTRL morphant fish (black dashed curve, n = 48), and spi1b morphant fish (black curves, n = 48) were used as control. Infected and control larvae were incubated at 28°C. Data plotted are from two pooled independent experiments. B) and E) Bacterial burden evaluation by quantification of % of fluorescent pixel counts on individual injected larvae followed over time by 0 to 72 hpi. Each larva was imaged daily, and images were analysed with Fiji for bacterial burden evaluation. One experiment per phagocyte type plotted, 6 larvae for each condition. D) Survival curves of CTRL morphant zebrafish larvae injected with a LD (blue dashed curve, n = 36) or a HD (red dashed curve, n = 36) of WT-GFP, or with a HD (green dashed curve, n = 24) of ΔdotA -GFP, and csf3r morphant zebrafish larvae injected with a LD (blue curve, n = 24) or a HD (red curve, n = 36) of WT-GFP, or with a HD (green curve, n = 36) of ΔdotA -GFP. Non-injected CTRL morphant fish (black dashed curve, n = 48), and csf3r morphant fish (black curve, n = 36) were used as control. Data plotted are from two pooled independent experiments. Significant differences are highlighted with stars (see experimental procedure for statistical analysis) C) and F) Representative images of L. pneumophila dissemination, determined by live imaging using a fluorescence stereomicroscope, of Tg(mfap4::mCherryF) spi1b morphant larvae (C) and of Tg(LysC::DsRed)nz50 (F) csf3r morphant larvae non infected, or infected with a LD or a HD of WT-GFP, or a HD of ΔdotA-GFP. The same infected larvae were live imaged 4h, 24h, 48h, and 72h post L. pneumophila injection. Overlay of GFP and mCherry fluorescence is shown. P < 0.05 was considered statistically significant (symbols: **** P < 0.0001; ***P < 0.001; **P < 0.01; *P < 0.05). No symbol on graphs means that not statistically differences were observed. |

Cytokine gene induction upon L. pneumophila infection and zebrafish larva Immunity to L. pneumophila is independent from signalling through MyD88 or compensated by other signalling pathways.
A-D) Cytokine gene (il1b, tnfa, ifng1, ifng2) induction was measured from non-injected larvae as control (CTRL, dashed black curves) and individual zebrafish larvae injected with a LD (blue curves) or a HD (red curves) of WT-GFP, or a HD of ΔdotA-GFP (green curves). Data plotted are from 2 pooled experiments (n = 10 larvae for each condition) for il1b and tnfa, and from 1 experiment (n = 5 larvae for each condition) for ifng1 and ifng2; individual values are shown, and curves correspond to the medians. Statistical analyses are shown in the table under each graph. E) Survival curves of CTRL zebrafish larvae injected with WT-GFP Low Dose (LD) (blue dashed curve) or High Dose (HD) (red dashed curve), or with ΔdotA -GFP HD (green dashed curve), and myd88hu3568 mutant zebrafish larvae injected with WT-GFP LD (blue curve) or HD (red curve), or with ΔdotA -GFP HD (green curve). Non-injected CTRL larvae (black dashed curves), and myd88hu3568 mutant larvae (black curves) were used as control. Infected and control larvae (n = 72 fish for myd88hu3568 mutant conditions and n = 57 fish for CTRL conditions) were incubated at 28°C. Data plotted are from 3 pooled independent experiments. F) Bacterial burden evaluation by quantification of % of fluorescent pixel counts on individual injected larvae followed over time from 0 to 72 hpi. Each larva was imaged daily, and images were analysed with Fiji for bacterial burden evaluation. Two pooled experiments, 8 larvae for each condition. P < 0.05 was considered statistically significant (symbols: **** P < 0.0001; ***P < 0.001; **P < 0.01; *P < 0.05). No symbol on graphs means that not statistically differences were observed. |