
- Title
-
Acetylcholine potentiates glutamate transmission from the habenula to the interpeduncular nucleus in losers of social conflict
- Authors
- Kinoshita, M., Okamoto, H.
- Source
- Full text @ Curr. Biol.
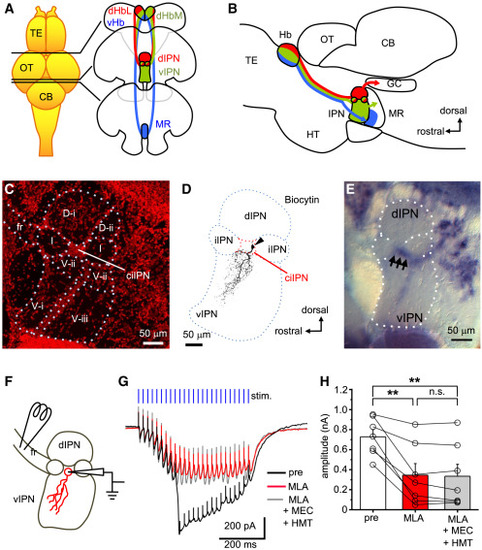
α7 nAChR is expressed in neurons of the v/iIPN and is responsible for the slow current induced by high-frequency stimulation of the fasciculus retroflexus (A) Subnucleus-specific projections from the Hb to the IPN. The dHbL and the dHbM project to the d/iIPN and the v/iIPN, respectively (red and green), and the vHb projects to the MR (blue). (B) A schematic diagram showing the sagittal view of the Hb-IPN pathway and its downstream targets. The dHbL-dIPN pathway sends output to the dorsal tegmental area (red), and the dHbM-vIPN pathway sends output to the MR (green). (C) Subdivisions of the IPN in a sagittal section. Nissl staining shows dorsal subdivisions (D-i and D-ii), ventral subdivisions (V-i, V-ii, and V-iii), and a cell-body area (center of the iIPN [ciIPN]). fr, fasciculus retroflexus. Scale bar, 50 μm. (D) Biocytin labeling of dendritic arborization of a representative ciIPN neuron (arrowhead). Scale bar, 50 μm. (E) Expression of α7 nAChR mRNA in the IPN. Arrows indicate dense signals detected in the ciIPN. Scale bar, 50 μm. (F) Relative positions of the recording and stimulating electrodes for the recording of ACh-mediated currents from ciIPN neurons. Electrical stimulation was applied to the fasciculus retroflexus (fr). (G) Representative traces of a recorded slow wave from a naive ciIPN neuron evoked by repetitive stimulations (blue vertical bars, 0.5 s, 50 Hz) before drug application (black), after bath application of the α7 nAChR antagonist, MLA (50 nM) (red), and in further addition of mecamylamine (MEC) and hexamethonium (HMT) (gray). Scale bars, 200 pA, 200 ms. (H) Comparison of peak amplitude before drug application, in the presence of MLA, and following the addition of MEC and HMT (n = 7 cells from 7 animals). CB, cerebellum; GC, griseum centrale; Hb, habenula; HT, hypothalamus; IPN, interpeduncular nucleus; OT, optic tectum; MR, median raphe; TE, telencephalon. Values are presented as mean ± SEM. Statistical significance was defined as ∗p < 0.05; ∗∗p < 0.01; NS, not significant, p ≥ 0.05. |

Pharmacological manipulations of α7 nAChR switch dominance in the dHbM-v/iIPN transmission (A) Schematic time course of experiments. (B, D, I, and L) Representative example of peak intracellular Ca2+ responses in a slice from the winner (B), loser (D), α7 nAChR agonist (1 μM PHA) treated winner (I), and antagonist (50 nM MLA) treated loser (L). Scale bars, 200 μm. (C, E, J, and M) The time course of the intracellular Ca2+ responses detected in the dIPN (pink) and the vIPN (blue) in winner (C), loser (E), winner treated with PHA (J), and loser treated with MLA (M). The representative example detected in a slice (left) and the average of responses in the group (right) are shown. Scale bars, 0.5% dF/F. (F and G) Comparison of normalized peak responses in the dIPN (F) and vIPN (G) among the naive (N, n = 11 slices from 11 animals), winner (W, n = 11 slices from 11 animals), and loser (L, n = 11 slices, from 11 animals). (H) Comparison of the vIPN/dIPN ratio calculated from the same samples with (F) and (G). (K) Comparison of normalized peak responses detected in the dIPN and vIPN in a winner (the same dataset as shown in F and G), and the cases with PHA treatment (n = 10 slices from 10 animals). (N) Comparison of normalized peak responses detected in the dIPN and vIPN in a loser (the same dataset as shown in F and G), and the cases with MLA treatment (n = 11 slices from 11 animals). Values are presented as mean ± SEM. Statistical significance was defined as ∗p < 0.05; ∗∗p < 0.01; ∗∗∗p < 0.001; NS, not significant, p ≥ 0.05. |

The agonist and antagonist of α7 nAChR switch dominance in the dHbM-v/iIPN transmission (A) Comparison of normalized peak responses detected in the dIPN and vIPN in a winner treated with Nic (5 μM; n = 10 slices from 10 animals), Nic + MLA (n = 9 slices from 9 animals, p = 0.722, paired t test), Nic + SR (20 μM; n = 9 slices from 9 animals), and Nic + DHβE (10 μM; n = 7 slices from 7 animals). (B–D) Comparison of the vIPN/dIPN ratio calculated from the samples shown in Figures 2F and 2G and (A). (E) Comparison of normalized peak responses in the dIPN and vIPN among α7 nAChR agonist-treated and untreated winner groups using the same datasets as shown in Figure 2K and (A). (F) Comparison of normalized peak responses in the dIPN and vIPN among nicotine and nAChR antagonists treated winner groups using the same datasets as shown in (A). (G) Comparison of normalized peak responses in the dIPN and vIPN between α7 nAChR antagonist treated and untreated loser groups using the same datasets as shown in Figure 2N. Values are presented as mean ± SEM. Statistical significance was defined as ∗∗p < 0.01; ∗∗∗p < 0.001; NS, not significant, p ≥ 0.05. |

Increase of GluA1 subunits in the postsynaptic membrane of ciIPN neurons in losers and its regulation by α7 nAChR (A) Examples of recorded AMPAR-eEPSCs from a winner or a loser sample evoked by a paired pulse with a 50-ms interval (red arrowheads). Scale bars, 10 pA, 30 ms. (B) Comparison of PPR among naive (N, n = 10 cells from 3 animals), winner (W, n = 10 cells, from 3 animals), and loser (L, n = 10 cells from 3 animals) groups. (C) Examples of recorded AMPAR-eEPSCs before and after the application of the homomeric GluA1 and GluA3 antagonist, PhTx (5 μM), on winner and loser slices. Scale bars, 40 pA, 20 ms. (D) Comparison of AMPAR-eEPSC peak amplitudes after PhTx application normalized with those before drug application among naive (N, n = 11 cells from 10 animals), winner (W, n = 12 cells from 11 animals), and loser (L, n = 13 cells from 12 animals) groups. (E and F) Examples of recorded AMPAR-mEPSCs from ciIPN neurons. AMPAR-mEPSCs of short and long durations were recorded from the winner and loser slices (E). Long-duration events were more frequent in ciIPN neurons of winners and short-duration events were more frequent in the losers (F). Orange and purple dots indicate short- or long-duration events. Scale bars, 5 pA, 10 ms (E) and 20 pA, 200 ms (F). (G) Examples of averaged AMPAR-mEPSCs recorded from a single cell in naive (top), winner (middle), and loser (bottom). For each trace, 100 miniature events were averaged. Amplitudes were scaled. Scale bar, 2 ms. (H and I) Comparison of time to peak (H) and half-decay time (I) of all recorded AMPAR-mEPSCs (100 events per one cell) from naive (N, n = 8 cells from 4 animals), winner (W, n = 15 cells from 9 animals), and loser (L, n = 11 cells from 6 animals) (left), and distributions of data (right). (J) The representative example of AMPAR-mEPSCs recorded from ciIPN neurons in a winner (left) or a loser (right) before (top) and after (bottom) application of PhTx (5 μM). Scale bars, 10 pA, 2 s. (K) The comparison of normalized AMPAR-mEPSC frequency between the winner (W, n = 5 cells from 5 animals) and loser (L, n = 5 cells from 5 animals). (L) The scatter plots of normalized AMPAR-mEPSC frequency versus time to peak (left) or half-decay time (right). Lines indicate the results of linear fit with all plots in the area. The sample set is the same as that in (K). Values are presented as mean ± SEM. Statistical significance was defined as ∗p < 0.05; ∗∗p < 0.01; NS, not significant, p ≥ 0.05. See also Figure S1. |

Regulation of GluA1 subunit expression in the postsynaptic membrane of ciIPN neurons by α7 nAChR (A and B) Comparison of time to peak and half-decay time of AMPAR-mEPSCs recorded from winners without drugs (using the same dataset as shown for winners in Figures 4H and 4I) and Nic (5 μM) or PHA (1 μM) treated winners (Nic, n = 6 cells from 3 animals; PHA, n = 8 cells from 3 animals) (A), and data distributions of these groups (B). Examples of averaged AMPAR-mEPSCs recorded from a single cell are shown on the top (from left to right: without drugs, Nic, and PHA). Scale bar, 2 ms. (C and D) Inhibition of Nic effect by MLA (50 nM), SR (20 μM), and DHβE (10 μM) in winner (Nic, using the same dataset as shown with Nic in A; Nic + MLA, n = 11 cells from 2 animals; Nic + SR, n = 5 cells from 3 animals; Nic + DHβE, n = 5 cells from 3 animals) (C), and data distributions of these groups (D). Examples of averaged AMPAR-mEPSCs recorded from a single cell are shown on the top (from left to right: without an antagonist, MLA, SR, and DHβE). Scale bar, 2 ms. (E and F) Comparison of time to peak and half-decay time of AMPAR-mEPSCs recorded from losers between those without drugs (using the same dataset as shown for the loser in Figures 4H and 4I) and those with MLA treatment (MLA, n = 4 cells from 2 animals) (E), and data distributions of these groups (F). Examples of averaged AMPAR-mEPSCs recorded from a single cell are shown on the top (without drugs, left; MLA, right). Scale bar, 2 ms. Values are presented as mean ± SEM. Statistical significance was defined as ∗p < 0.05; ∗∗p < 0.01; ∗∗∗p < 0.001. See also Figure S1. |
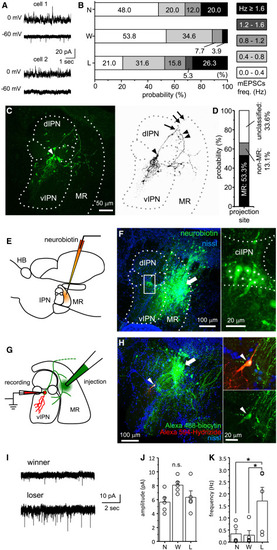
Enhanced synaptic transmission to MR-projecting neurons in the ciIPN of losers (A) Examples of AMPAR-mEPSCs (voltage-clamped at −60 mV) and GABAAR-mIPSCs (voltage-clamped at 0 mV) recorded from two ciIPN neurons. AMPAR-mEPSCs were recorded with extremely low frequency in one neuron (bottom). See also Figure S2A for a comparison of mEPSC amplitude and frequency among naive, winner, and loser groups. Scale bars, 20 pA, 1 s. (B) Relative distributions of neurons in ciIPN of naive (N; n = 25 cells from 15 animals), winner (W; n = 26 cells from 10 animals), and loser (L; n = 18 cells from 8 animals) groups classified with their mEPSC frequency. (C) An example of fluorescent imaging of axonal morphology of an MR-projecting ciIPN neuron (left) and excerpted grayscale imaging (right). One of the axonal branches was toward the MR (double arrowheads) and the other further extended caudally (double arrows). Arrow, branching point of axon; arrowhead, soma. Scale bar, 50 μm. (D) The proportion of ciIPN neurons classified by their axonal projection sites. (E) A schematic diagram showing the relative position of the neurobiotin injection electrode for retrograde labeling from the MR. (F) Retrogradely labeled MR-projecting neurons with neurobiotin in the ciIPN (rectangle), which are magnified on the right panel. Arrow, dye injection site; asterisks, the soma of labeled neurons. Scale bars, 100 μm, 20 μm. (G) A schematic diagram showing the relative positions of the recording electrode and injection sites for retrograde labeling in acute slices. (H) A representative recorded efferent ciIPN neuron. Arrow, injection site; arrowheads, cell body. Scale bars, 100 μm, 20 μm. (I) Representative traces for AMPAR-mEPSCs recorded from MR-projecting ciIPN neurons in winner or loser. Scale bars, 10 pA, 2 s. (J and K) Comparison of AMPAR-mEPSC amplitude (J) and frequency (K) recorded from naive (N, n = 5 cells from 5 animals), winner (W, n = 5 cells from 5 animals), and loser (L, n = 5 cells from 4 animals) groups. Values are presented as mean ± SEM. Statistical significance was defined as ∗p < 0.05; NS, not significant, p ≥ 0.05. See also Figure S3. |

The excitability of the Hb does not differ between winners and losers (A) Representative spiking activities (top) induced by current injection (bottom) in a dHbL neuron from naive (left), winner (middle), or loser (right) fish. (B) Comparison of the numbers of recorded spikes in dHbL neurons among naive (N, n = 10 cells from 3 animals), winner (W, n = 12 cells from 3 animals), loser (L, n = 11 cells from 3 animals), winner + PHA (W + PHA, n = 12 cells from 3 animals), and loser + MLA (L + MLA, n = 12 cells from 3 animals) groups. (C) Representative spiking activities (top) induced by current injection (bottom) in a dHbM neuron from naive (left), winner (middle), or loser (right) fish. (D) Comparison of the numbers of recorded spikes in dHbM neurons among naive (N, n = 11 cells from 3 animals), winner (W, n = 12 cells from 3 animals), loser (L, n = 12 cells from 3 animals), winner + PHA (W + PHA, n = 11 cells from 3 animals), and loser + MLA (L + MLA, n = 11 cells from 3 animals) groups. Values are presented as mean ± SEM. Statistical significance was defined as ∗p < 0.05; ∗∗p < 0.01. Scale bars for (A) and (C), 10 pA, 200 ms. |