
- Title
-
Development of a Triple-Negative Breast Cancer Leptomeningeal Disease Model in Zebrafish
- Authors
- Gopal, U., Monroe, J.D., Marudamuthu, A.S., Begum, S., Walters, B.J., Stewart, R.A., Washington, C.W., Gibert, Y., Zachariah, M.A.
- Source
- Full text @ Cells

Microinjection of fluorescent labeled TNBC cells into the zebrafish hindbrain ventricle facilitated measurement of tumor area and metastasis. (A). Top row left: lateral view of zebrafish embryo prior to injection; top row center: lateral view of embryo injection; top row right: diagram of zebrafish microinjection with cancer cells indicated in red; bottom row far left: dorsal bright-field view of zebrafish cranial region; bottom row inner left: dorsal view after microinjection with green dextran fluorescein dye (to label ventricle); bottom row inner right: dorsal view after microinjection with red DiI-labeled TNBC cells; bottom row far right: dorsal view of red–green color combination. (B). Hematoxylin and eosin staining cross-sectional study showing rostral view (top row) and caudal view (bottom row) comparing control uninjected samples (left panels) with ventricle MDA-MB-231 TNBC-injected samples (right panels; injected TNBC cells indicated in different brain ventricles with arrows) (C). Schematic timeline for experiments showing days postfertilization (dpf), days postinjection (dpi), injection time (Inj), and imaging time points. (D). Fluorescent tracking of MDA-MB-231-Luc/RFP labeled TNBC cells over 1, 4, 6, and 8 dpi (arrow heads: labeled cancer cells localized in hindbrain; arrow: labeled cancer cells in caudal section). (E). Measurement of corrected total cell fluorescence at 1, 4, 6, and 8 dpi. Key: corrected total cell fluorescence (CTCF); p < 0.05, “****” = 0.0001; Error bars = SEM; N for 1, 4, and 6 dpi samples = 44; N for 8 dpi samples = 29. |

Fluorescent tracking of secondary tumor migration in zebrafish MDA-MB-231 TNBC xenografts. (A). Bright-field view of a 6 dpf AB zebrafish larvae (left) and fluorescent channel image of larvae (right) microinjected with DiI-treated MDA-MB-231 TNBC cells at 4 dpi. (B–D). Bright-field view (left) and fluorescent view (right) of caudal sections of migrated MDA-MB-231 TNBC cells in the spinal cord of AB zebrafish larvae at 8 dpi. (B): anterior; (C): medial; (D): posterior caudal section of the zebrafish larvae. |
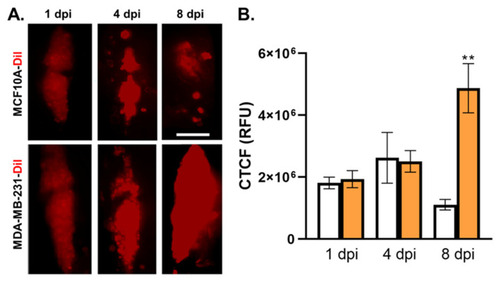
MDA-MB-231 TNBC cells exhibited increased tumor area in the zebrafish hindbrain ventricle compared to noncancerous breast tissue cells. (A). Top row: images of noncancerous breast tissue MCF10A xenograft cells treated with DiI in the hindbrain ventricle at 1, 4, and 8 dpi; bottom row: images of cancerous breast tissue MDA-MB-231 xenograft cells treated with DiI in the hindbrain ventricle at 1, 4, and 8 dpi. (B). Comparison of MCF10A (white columns) and MDA-MB-231 (orange columns) corrected total cell fluorescence values at 1, 4, and 8 dpi. Key: days postinjection (dpi); corrected total cell fluorescence (CTCF); relative fluorescence units (RFU); p < 0.05, “**” = 0.01; Error bars = SEM; scale bar = 100 µm; N for MCF10A: 27 (1 dpi), 30 (4 dpi), 33 (8 dpi); N for MDA-MB-231: 27 (1 and 4 dpi), 35 (8 dpi). |

Doxorubicin treatment decreased tumor area compared to DMSO vehicle in zebrafish MDA-MB-231 TNBC xenografts. (A). Top row: images showing the area occupied by MDA-MB-231-Luc/RFP TNBC cells in zebrafish xenograft samples treated with DMSO vehicle at 1, 4, and 8 days postinjection; bottom row: images showing the area occupied by MDA-MB-231-Luc/RFP TNBC cells in zebrafish xenograft samples treated with 8 µM doxorubicin at 1, 4, and 8 dpf. (B). Measurement of corrected total cell fluorescence for DMSO-treated samples (white columns) and doxorubicin-treated samples (blue columns) at 1, 4, and 8 dpi. Key: CTCF = corrected total cell fluorescence; RFU = relative fluorescence units; Dox = doxorubicin. N = 3 biological replicates with 26–30 total technical replicates. “****” = p < 0.0001; Error bars = SEM. Scale bar = 200 µm. |
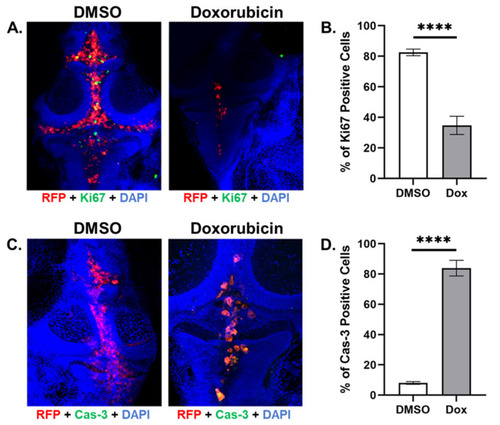
Doxorubicin treatment decreased cell proliferation and increased cell death compared to DMSO vehicle in zebrafish MDA-MB-231 TNBC xenografts. (A). Z-stack analysis combining red (MDA-MB-231-Luc/RFP cells), green (Ki67-stained cells), and blue (DAPI-nuclear-stained cells) filter images show that xenograft samples treated with DMSO vehicle exhibited more Ki67 staining than samples treated with doxorubicin at 8 dpi. (B). Doxorubicin treatment reduced the percentage of Ki67-positive cells compared to DMSO-vehicle-treated cells at 8 dpi. (C). Z-stack analysis combining red (MDA-MB-231-Luc/RFP cells), green (cleaved-caspase-3-stained cells), and blue (DAPI-nuclear-stained cells) filter images show that xenograft samples treated with DMSO vehicle exhibited more cleaved caspase-3 staining than samples treated with doxorubicin at 8 dpi. (D). Doxorubicin treatment increased the percentage of cleaved-caspase-3-positive cells compared to DMSO-vehicle-treated cells at 8 dpi. Key: RFP = red fluorescent protein; DAPI = 4′,6-diamidino-2-phenylindole; Cas-3 = caspase-3; Dox = doxorubicin. N = 10; “****” = p < 0.0001; Error bars = SEM. |