
- Title
-
Long noncoding RNA HIKER regulates erythropoiesis in Monge's disease via CSNK2B
- Authors
- Azad, P., Zhou, D., Tu, H.C., Villafuerte, F.C., Traver, D., Rana, T.M., Haddad, G.G.
- Source
- Full text @ Journal of Clin. Invest.

(A) CD34+ cells were isolated from blood (PBMCs) obtained from CMS or non-CMS subjects, pooled, and treated with hypoxia or room air (as control). Following the treatment, total RNA was isolated, and the quality was determined with TapeStation. Ribosome-depleted (ribodepleted) libraries were generated and sequenced. The candidate hypoxia-responding lncRNAs were identified and prioritized for further qRT-PCR–based evaluation and functional analyses. (B) Hypoxia treatment induced distinct transcriptional responses in CMS and non-CMS cells. A total of 426 or 1,702 hypoxia-induced DEGs were identified in the CMS and non-CMS cells, respectively, with little overlap. Further annotation revealed a distinct group of 5 lncRNAs in the CMS DEGs and 36 lncRNAs in the non-CMS DEGs, suggesting specific lncRNA-mediated hypoxia responses between CMS and non-CMS subjects (see also Supplemental Table 1). |

(A) qRT-PCR validation of all 5 lncRNAs that were differentially altered (up- and downregulated) in the CMS cell group (Supplemental Table 1). iPSC-derived CD34+ cells after exposure to hypoxia and normoxia (for 3 days) were used for this assay. Expression levels were tested and validated in both CMS (n = 3) and non-CMS (n = 3) cells under hypoxia and normoxia. *P < 0.05, t test. HIKER/LINC02228 was tremendously upregulated in the CMS cells under hypoxia. (B) qRT-PCR validation of top 10 upregulated lncRNAs in the non-CMS cell group (Supplemental Table 1). iPSC-derived CD34+ cells after exposure to hypoxia and normoxia (for 3 days) were used for this assay. Expression levels were tested and validated in both CMS (n = 3) and non-CMS (n = 3) cells under hypoxia and normoxia. *P < 0.05, t test. (C) qRT-PCR validation of top 10 downregulated lncRNAs in the non-CMS cell group (Supplemental Table 1). iPSC-derived CD34+ cells after exposure to hypoxia and normoxia (for 3 days) were used for this assay. Expression levels were tested and validated in both CMS (n = 3) and non-CMS (n = 3) cells under hypoxia and normoxia. *P < 0.05, t test. (D) Nuclear and cytoplasmic localization of lncRNAs. qRT-PCR results of confirmation for the expression changes for HIKER/LINC02228, LINC00431 (nuclear) and LINC01133, and APOBEC3B-AS1 and UBE2Q1-AS1 (cytoplasmic) for CMS, non-CMS and sea-level erythroid cells under hypoxia and normoxia. iPSC-derived CD34+ cells after exposure to hypoxia and normoxia (for 3 days) were used for this assay. *P < 0.05, t test. n = 3 subjects for each group. |
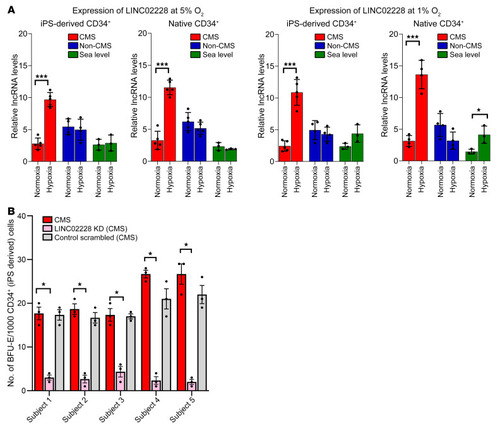
(A) qRT-PCR results confirming the expression changes for HIKER/LINC02228 for CMS, non-CMS, and sea-level subjects under normoxia and in response to hypoxia in iPSC-derived and PBMC-derived native CD34+ cells. Left panels show the expression of LINC02228 at 5% O2, and right panels show the results at 1% O2. The figure shows the expression changes in iPSC-derived CD34+ cells as well as native CD34+ cells, as labeled in the figure. Native CD34+ cells: n = 5 (CMS and non-CMS cells); n = 3 (sea-level subjects). iPSC-derived CD34+ cells: n = 5 (CMS and non-CMS cells); n = 3 (sea-level subjects). *P < 0.05; ***P < 0.01, t tests for comparison with hypoxia and normoxia values for each sample. (B) Functional analysis of HIKER/LINC02228 in iPSC-derived CD34+ cells using methylcellulose colony assay. Panel shows significant reduction of BFU-E under hypoxia with KD of each lncRNA in CMS in each subject. n = 5 subjects. Each subject was tested at least 3 times. *P < 0.01. One-way ANOVA was performed in multiple comparisons, followed by Tukey’s tests. |
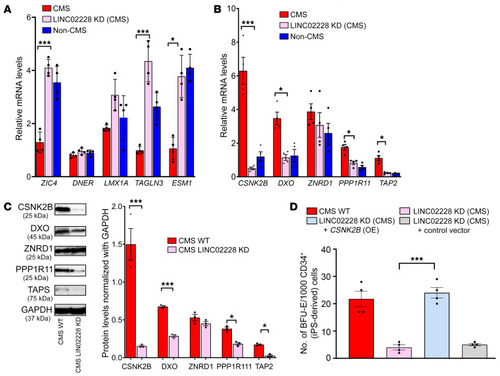
(A) qRT-PCR results confirming expression changes for RNA-Seq analysis of the KD of HIKER/LINC02228 versus controls. Top 5 upregulated genes are shown. qPCR was performed on iPSC-derived CD34+ cells. n = 4 subjects per group. *P < 0.05; ***P < 0.001. t tests were performed to compare expression levels of CMS (WT) with CMS (KD of HIKER) for each gene. (B) qRT-PCR results confirming the expression changes for RNA-Seq analysis of the KD of HIKER/LINC02228 versus controls. Top 5 downregulated genes are shown. qPCR was performed on iPSC-derived CD34+ cells. n = 4 subjects per group. *P < 0.05; ***P < 0.001. t tests were performed to compare the expression levels of CMS (WT) with CMS (KD of LINC02228/HIKER) for each gene. (C) Western blot confirmation of the top 5 downregulated candidates, CSNK2B, DXO, ZNRD1, PP1R11, and TAP2. Week 1 EBs (iPSC derived) were used in this assay as described in Methods. Left: representative image for each protein candidate. Right: summary of densitometric analysis of each protein with n = 3 for each group. *P < 0.05; ***P < 0.001; t test was performed to compare the protein levels with CMS (WT) and CMS (KD of LINC02228/HIKER). (D) Functional analysis of HIKER/LINC02228 as well as CSNK2B-OE-LINC02228-KD in iPSC-derived CD34+ cells using methylcellulose colony assay. With the OE of CSNK2B gene in the background of HIKER/LINC02228 KD, mean number of BFU-E colonies/CD34+ is increased, suggesting a critical function of this gene in the mechanism of action of HIKER/LINC02228. n = 4 subjects per group. ***P < 0.001. One-way ANOVA was performed in multiple comparisons followed by Tukey’s tests. |

(A) CSNK2B KD in CMS decreases BFU-E, and CSNK2B OE in non-CMS increases BFU-E, suggesting its critical role in regulating erythropoiesis. **P < 0.001. (B) Effect of CK2 inhibitor on CMS cells. TBB decreases BFU-E colonies in CMS cells in a dose-dependent manner. *P < 0.05; **P < 0.001. (C) Effect of CK2 inhibitor on CMS cells. CX4945 decreases BFU-E colonies more drastically in the CMS cells in a dose-response manner. **P < 0.01; ***P < 0.001; ****P < 0.0001. (D) CSNK2B KD results in major expression changes of critical TFs. qPCR results confirm decreased expression of TAL1, KLF1, RUNX1, IKAROS, and GATA1. *P < 0.05; ***P < 0.001. (E) GATA1 expression levels were altered significantly by modulation of CSNK2B levels in CMS and non-CMS cells under hypoxia. Graph shows GATA1 expression as measured by qPCR in (a) CMS cells, (b) CMS cells with CSNK2B KD, (c) CMS cells treated with CK2 inhibitor, (d) non-CMS cells, and (e) non-CMS cells with CSNK2B-OE. *P < 0.05; **P < 0.01. (F) CSNK2B regulates erythropoietic response through GATA1. Graph shows the effect of CSNK2B and GATA1 modulation on colony-forming potential of CMS and non-CMS cells. GATA1 OE partially rescues the erythropoietic suppression caused by CSNK2B in CMS. Further, KD of GATA1 in non-CMS results in loss of excessive erythropoiesis caused by OE of CSNK2B. *P < 0.05; **P < 0.001. For all the experiments (colony-forming assays as well as qPCR), iPSC-derived CD34+ cells were used. n = 3 per group. For A–F, 1-way ANOVA was performed, followed by multiple comparisons by Tukey’s test. For D, t tests were performed for each comparison. |
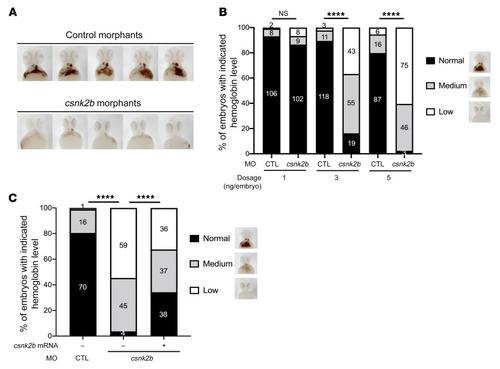
(A) Csnk2b is required for hemoglobinization of zebrafish erythrocytes. Representative images of hemoglobin signal in control and csnk2b morphants stained with o-dianisidine at 2 dpf. Images shown are ventral views with heads to the top. (B) Statistical analyses showing dose-dependent loss of hemoglobin in embryos injected with 1, 3, or 5 ng of control (CTL) or csnk2b morpholino. (C) Statistical analysis of hemoglobin phenotypes in control and csnk2b morphants with or without rescue of csnk2b mRNA. Representative images of hemoglobin classification criterion are shown on the right side of the graph. Data collected from 3 independent experiments, with corresponding embryo numbers displayed on the columns. ****P < 0.0001. For B and C, χ2 tests were performed to examine the statistical difference of the phenotype distribution between groups. |