
- Title
-
Transplantation-based screen identifies inducers of muscle progenitor cell engraftment across vertebrate species
- Authors
- Tavakoli, S., Garcia, V., Gähwiler, E., Adatto, I., Rangan, A., Messemer, K.A., Kakhki, S.A., Yang, S., Chan, V.S., Manning, M.E., Fotowat, H., Zhou, Y., Wagers, A.J., Zon, L.I.
- Source
- Full text @ Cell Rep.

Limiting dilution assay experimental procedure and statistical analysis (A) Outline of experimental design. Myogenic progenitors were generated in vitro from mylz2-GFP or mylz2-mCherry embryos. For limiting dilution assay screening, cells were transplanted into pre-irradiated casper recipients (4–8 months old) followed by imaging of the recipient fish at 7 days post transplantation (dpt). The number of transplanted cells is indicated separately for each experiment. (B) Images of muscle engraftment visualized in the same fish by expression of the muscle-specific (mylz2-mCherry) reporter. Ten thousand cells were transplanted into casper fish and were stably observed for as long as 1 year post transplant. Mylz2, myosin light polypeptide chain 2 (red); dpt, days post transplantation; ypt, year post transplantation. n = 3. Scale bar, 500 μm. (C) Engrafted muscle-specific (mylz2-mCherry) cells are visible to the naked eye. Red, mylz2 (myosin light polypeptide chain 2). (D) Log-fraction plot of the limiting dilution model fitted to the data in Table S1. The plot represents the fraction of positive responses as a function of the dose of cells delivered in each transplantation. The triangle marks 100% engraftment efficiency with 700-cell transplantation. The line slope is the log-active cell fraction, and the two flanking dotted lines give the 95% confidence interval, as listed in the top table. See Table S1 for numbers. (E) myf5-GFP;mylz2-mCherry double-transgenic line cells were sorted into four subsets: myf5-GFP cells, mylz2-mCherry cells, double-positive cells, and double-negative cells. Each subset was evaluated for engraftment efficiency via limiting dilution assay. (F) Muscle progenitor cells (myf5-GFP) show superior muscle engraftment in recipient fish (n = 10 per cell number dose and 30 per cell population; ∗∗∗p < 0.001, ∗∗p < 0.01, ∗p < 0.05; ns, not significant; limiting dilution assay). (G) The estimated potency of engrafting cells (1/cell frequency) derived from extreme limiting dilution analysis (ELDA). Error bars represent the upper and lower confidence intervals. (H) Experimental design of the donor and muscle cell fusion assay. One million mylz2-GFP ZeMPCs were transplanted into Tg(mylz2-mCherry) recipients (4–8 months old). (I) A cross-section of a recipient fish at 7 dpt showing fusion of host and donor muscle fibers at the boundary of the engrafted region. The bottom row shows a zoomed image of the box in the top row (n = 5). Red and green, mylz2 (myosin light polypeptide chain 2); blue, nuclei (DAPI). Scale bar, 500 μm. |

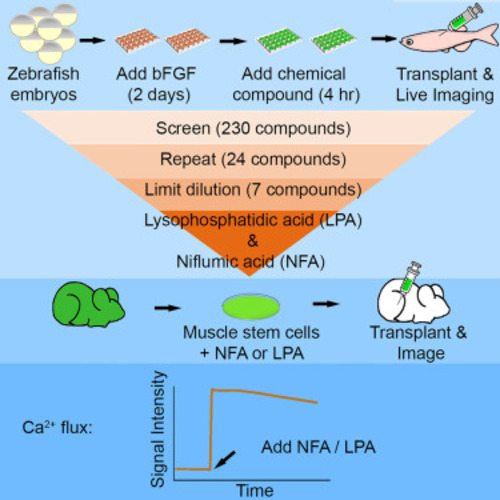
Ex vivo exposure to NFA or LPA enhances the engraftment efficiency of zebrafish muscle cells in vivo (A) Outline of experimental strategy. ZeMPCs were incubated with lipids for 4 h at 28.5°C, followed by washing out of the media and drugs, harvesting the cells, and splitting into three cell doses (25, 75, or 200 cells/recipient) for transplantation. Treated cells were transplanted into each side of five pre-irradiated casper recipient fish or five non-irradiated prkdc-mutant recipient zebrafish (4–8 months old), followed by imaging of the recipient fish at 7 dpt. (B) Engraftment efficiency as assessed across different compound exposure times. LPA enhances the engraftment efficiency of ZeMPCs treated for 4 h, while NFA enhances the engraftment efficiency after 2 h and 4 h of exposure. (C) The potency of engrafting cells (1/cell frequency) from (B) was estimated with ELDA. Error bars represent the upper and lower confidence intervals (see Table S3 for p values). (D and E) Engraftment efficiency of LPA-treated (D) or NFA-treated (E) ZePMCs assessed across different compound concentrations, as indicated. (F and G) The potency of engrafting cells (1/cell frequency) from (D) and (E) was estimated with ELDA. Error bars represent the upper and lower confidence intervals (see Tables S4 and S5 for p values). DMSO concentration for all groups including experimental controls and as vehicle for NFA and LPA was 0.1% (n = 10 per cell number dose and 30 per treatment; ∗∗p < 0.01, ∗p < 0.05; ns, not significant; limiting dilution assay). |
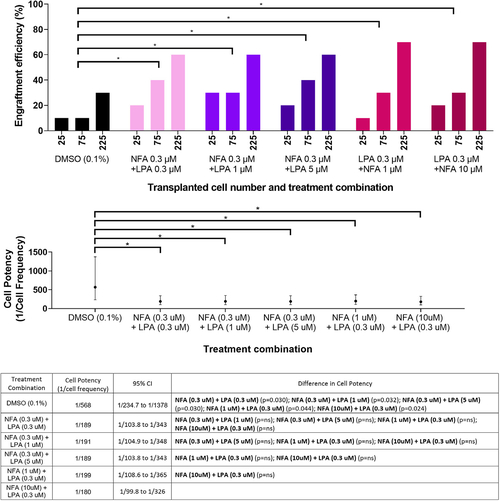
NFA and LPA show an additive effect on muscle progenitor cell engraftment efficiency in zebrafish (A) Engraftment efficiency in prkdc-mutant recipient zebrafish (4–8 months old) of ZeMPCs treated for 4 h with the indicated concentrations and combinations of NFA and LPA, or with DMSO (vehicle) as control. (B) The potency of engrafting cells (1/cell frequency) from (A) was estimated with ELDA. Error bars represent the upper and lower confidence intervals. (C) Statistical differences (p values) between groups were determined with ELDA. DMSO concentration for all groups including experimental controls and as vehicle for NFA and LPA was 0.1%. n = 10 fish per cell number dose and 30 per treatment (∗p < 0.05; limiting dilution assay). |

NFA and LPA treatments enhance the engraftment efficiency of mouse satellite cells (A) Experimental design. (B and C) Engraftment efficiency of 4-h-treated mouse satellite cells with vehicle, LPA (5 μM), or NFA (10 μM). Five thousand treated cells from FVB-Tg(CAG-eGFP) mice were injected into pre-injured TA muscles of non-transgenic FVB/NJ recipient, and engraftment was measured by counting the number of GFP+ myofibers. Data are presented as mean ± SEM. Statistical analysis by unpaired t test; both treatment groups were significantly different from the control group (n = 10). (D) Transverse frozen section of TA muscles injected with 5,000 treated satellite cells. Cell membrane (WGA, red), nuclei (DAPI, blue), and engrafted cells (GFP, green). These studies used 8- to 16-week-old male mice as recipients. DMSO concentration for all groups including experimental control and as vehicle for NFA and LPA was 0.1%. Scale bar, 200 μm. (E) Engraftment efficiency of 4-h-treated mouse satellite cells with vehicle, LPA (5 μM), or NFA (10 μM). Two thousand treated cells from C57BL/CAG-EGFP mice were injected into pre-injured TA muscles of PrkdcscidDmdmdx recipients, and engraftment was measured by counting the number of GFP+ myofibers. Data are presented as mean ± SEM. Statistical analysis by one-way ANOVA; both treatment groups were significantly different from the control group (n = 9 for vehicle and n = 7 for LPA and NFA treatment groups). (F) Restoration of dystrophin in engrafted PrkdcscidDmdmdx recipients using a mouse-specific dystrophin antibody (Sigma, D8043). Nuclei (DAPI, blue), engrafted cells (GFP, green), and dystrophin (Alexa Fluor 594, red). Scale bar, 50 μm. (G) NFA and LPA treatments do not change the rate of incorporation of transplanted satellite cells into the in vivo pool of muscle precursors. Donor mouse satellite cells were isolated from Pax7:ZsGreen mice and treated for 4 h with vehicle (0.1% DMSO), LPA (5 μM), or NFA (10 μM). Five thousand treated cells were transplanted into pre-injured TA muscles of WT (C57BL/6J) recipients, and the engrafted donor satellite cells (ZsGreen+) were counted via flow cytometry 4 weeks after transplantation. Data are presented as mean ± SEM. Statistical analysis by one-way ANOVA with Dunnett’s correction (n = 4 for vehicle and n = 5 for LPA and NFA treatment groups). These studies used adult (8–16 weeks of age) male mice. |
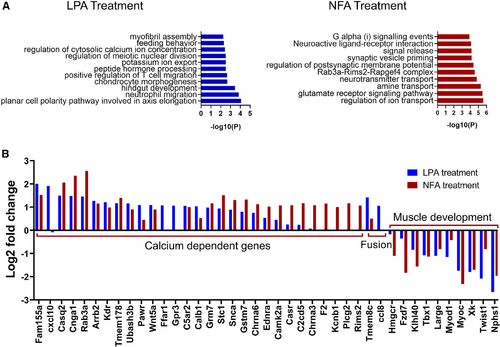
Differential gene expression patterns reveal the upregulation of calcium-ion-dependent genes and downregulation of muscle development genes in NFA-treated and LPA-treated mouse satellite cells (A) Gene ontology enrichment analysis of differentially expressed genes in NFA-treated or LPA-treated mouse satellite cells. (B) Log2 fold change in expression of selected genes in LPA- and NFA-treated mouse muscle stem cells. These studies used adult (8–16 weeks of age) FVB/NJ male mice. |

Engrafted cells improve swimming performance in mutant zebrafish (A) Schematic of swimming chamber and analysis strategy. (B) Comparison of sapje-like fish (4–8 months old, n = 6–9 fish for each treatment condition) swimming performance before and after transplantation. DMSO concentration for all groups including experimental control and as vehicle for NFA and LPA was 0.1% (∗p < 0.05, ∗∗p < 0.01; ns, not significant; paired t test). |
|