
- Title
-
Novel SMAD3 variant identified in a patient with familial aortopathy modeled using a zebrafish embryo assay
- Authors
- Sheppard, M.B., Smith, J.D., Bergmann, L.L., Famulski, J.K.
- Source
- Full text @ Front Cardiovasc Med

Cardiac, aortic, and coronary artery findings in a 55 year old male with the SMAD3 V244F variant. (A) Pedigree demonstrating sex and phenotype. Squares and circles represent males and females, respectively. TAA is red upper left quadrant. AAA is blue upper right quadrant. AF is green lower right quadrant. MVP is yellow lower left quadrant. (B) Aortic root aneurysm and Focal bilobed fusiform ectasia of the proximal RCA. Linear reformat of coronary CTA was created using TeraRecon (Durham, North Carolina). (C) Axial CTA demonstrating tortuosity and ectasia of the right coronary artery (RCA). (D) Infrarenal abdominal aortic aneurysm, 37 mm in maximum diameter. Mural hematoma in the right lateral aspect of the aneurysm is displayed in red. Cinematic 3D reformatted images of CTA abdomen and pelvis. Cinematic 3D were created using syngo.via (Siemens, Erlangen). (E) Calcification of the left coronary artery and its branches with 25-49% stenosis in the LAD. TAA is thoracic aorta aneurysm, AAA is abdominal aortic aneurysm, AF is atrial fibrillation, MVP is mitral valve prolapse 3D is 3-dimensional, CTA is computed tomographic angiography, RCA is right coronary artery, LAD is left anterior descending artery. |
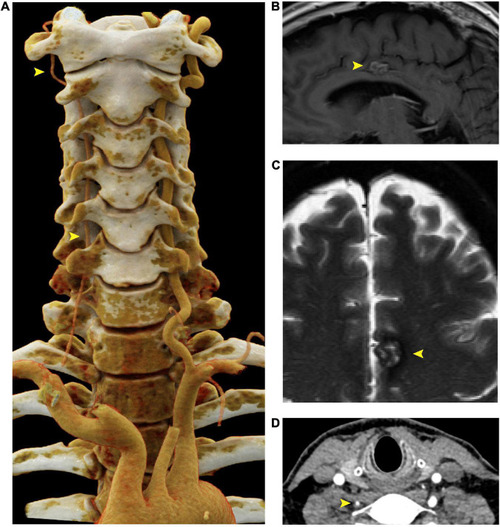
Right vertebral artery atresia and cavernoma in a 55 year old male harboring a SMAD3 V244F variant. (A) Cinematic 3D reformatted images of the atretic < 2mm right vertebral artery. The origin of the right vertebral artery was sufficiently narrow in caliber that volume averaging resulted in below-threshold density required for visualization in the reformat. For best visualization of the vertebral arteries, the carotid arteries were digitally removed using syngo.via (Siemens, Erlangen). The dominant left vertebral artery measures 5 mm in diameter throughout most of its length, which is the upper limit of normal. (B) Sagittal T1-weighted FLAIR MRI of the brain at the midline shows a cavernous malformation in the left mid cingulate gyrus, just superior to the body of the corpus callosum. (C) Axial T2-weighted MRI with fat saturation demonstrates characteristic signal intensity of cavernous malformation with central hyperintensity, peripheral hypointensity, and susceptibility artifact. (D) Axial CTA demonstrating atretic < 2mm right vertebral artery. FLAIR is fluid-attenuated inversion recovery, MRI is magnetic resonance imaging. |

Zebrafish embryo-based assay for SMAD3 variant pathogenesis. (A) Degree of conservation in amino acid sequence between Smad3a in zebrafish and human SMAD3. Overall, similarity is at ∼97% indicating a very high level of conservation between the species. Residue V244 is highlighted to emphasize total conservation between zebrafish and human Smad3. (B) Confocal images of the tail aorta/vein labeled in Tg[kdrl:mCherry] in 48hpf embryos. White dashed boxes indicate the enlargement regions used to highlight differences in diameter (white dashed lines). Embryos imaged were either control, injected with smad3aWT mRNA or smad3aT261I or smad3aV244F. (C) Quantification of diameter counts. Each point represents an individual embryo measured. Standard deviation is depicted in red. *p < 0.05, ***p < 0.001. EXPRESSION / LABELING:
|
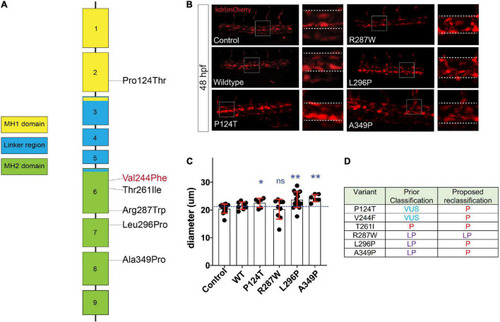
Assessment of SMAD3 VUS pathogenicity using a zebrafish embryonic assay. (A) Diagram of the spatial distribution of specific VUS mutations examined. (B) Confocal images of the tail aorta/vein labeled in Tg[kdrl:mCherry] in 48hpf embryos. White dashed boxes indicate the enlargement regions used to highlight differences in diameter (white dashed lines). Embryos imaged were either control, injected with smad3aWT mRNA or smad3aP124T, smad3aR287W, smad3aL296P or smad3aA349P. (C) Quantification of diameter counts. Each point represents an individual embryo measured. Standard deviation is depicted in red. Variants were compared to WT: *p < 0.05, **p < 0.01. (D) Summary of VUS classification changes based on the zebrafish embryonic assay results. P, pathogenic, LP, likely pathogenic. |