
- Title
-
Single-cell-resolved dynamics of chromatin architecture delineate cell and regulatory states in zebrafish embryos
- Authors
- McGarvey, A.C., Kopp, W., Vučićević, D., Mattonet, K., Kempfer, R., Hirsekorn, A., Bilić, I., Gil, M., Trinks, A., Merks, A.M., Panáková, D., Pombo, A., Akalin, A., Junker, J.P., Stainier, D.Y.R., Garfield, D., Ohler, U., Lacadie, S.A.
- Source
- Full text @ Cell Genom
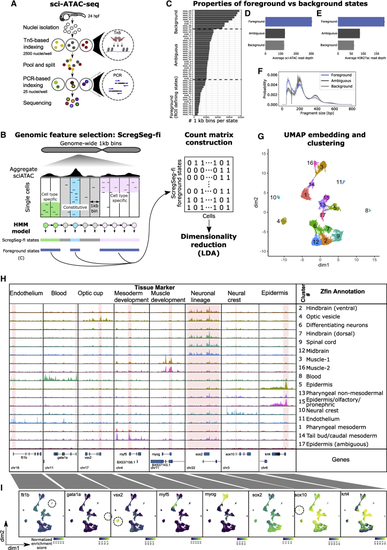
Generating cell-type-specific accessibility profiles from 24-hpf zebrafish embryos (A) Schematic of sci-ATAC-seq method. Nuclei are extracted from flash-frozen whole embryos staged at 24 hpf. Nuclei are sorted into 96-well plates, 2,500 per well, and barcoded during tagmentation. Tagmented nuclei are pooled and then split into 96-well plates, 25 per well, and a second set of barcodes introduced by PCR. The resulting DNA fragments are pooled and sequenced, with unique barcode combinations representing single cells. (B) Schematic representation of ScregSeg for genomic feature identification (ScregSeg-fi). The genome is divided into 1-kb bins and segmented using an HMM that assigns a state to each bin based on the accessibility distribution over cells. Subsequently, putative informative (foreground) states are used to define the regions of interest for the dimensionality reduction using latent Dirichlet allocation (LDA). (C) Number of 1-kb regions per state (state frequency). States with low, medium, or high numbers of assigned genomic regions were grouped into “foreground,” “ambiguous,” and “background.” Foreground states were selected based on the state frequency. (D) Average number of sci-ATAC-seq reads at 1-kb genomic regions assigned to foreground, ambiguous, and background states. Error bars indicate the 95% confidence intervals around the mean (as determined by seaborn.barplot). (E) Average number of bulk H3K27sc ChIP-seq reads at 1-kb genomic regions assigned to foreground, background, or ambiguous states. Error bars indicate the 95% confidence intervals around the mean (as determined by seaborn.barplot). (F) Normalized fragment size distribution of 1-kb genomic regions assigned to foreground, ambiguous, and background states. Ribbons represent 95% confidence intervals around the mean (as determined by seaborn.lineplot). (G) UMAP representation of the dimensionality-reduced and batch-corrected feature matrix (cell-Topic matrix) on ∼23,000 cells. Colors represent the 17 clusters determined by density clustering. (H) Summary pseudo-bulk chromatin accessibility profiles from aggregated cells for each density cluster at marker genes of major tissues and cell types of 24-hpf zebrafish embryos. Consensus annotations derived from enrichment of genes that map to differentially accessible segments per cluster, with ZFIN anatomical database terms and published cell-type markers. (I) Per-cell distribution of accessibility at regions covering the promoters of marker genes, represented in UMAP space. Color represents the rank-based AUCell enrichment score for a given region. |

Segmentation of accessibility profiles reveals cell-type-specific and shared regulatory regions (A) Schematic representation of ScregSeg for identifying regulatory programs (ScregSeg-pi). The genome is divided into 500-bp bins and segmented based on the accessibility distribution over the cluster-collapsed accessibility tracks using a 30-state HMM. The bins are assigned to states that give rise to the classification of the regulatory landscape of the genome. (B) Heatmap representing the association between states and clusters based on the log-ratio between the states’ emission probabilities and the (normalized) overall read coverage per cluster, which accounts for read depth per cluster (see (C) Two examples of a cell-type cluster (tail bud and midbrain) that are associated with multiple ScregSeg-pi states (26, 25, and 13 and 5 and 24, respectively). The right-hand panel shows the per-cell distribution of accessibility at the gene body of genes mapping to segments, with the top 100 logFC enrichments for each of these states. |

Motif extraction via deep learning (A) A convolutional neural network was used to extract sequence motifs that are predictive of the expected state-read depth score, a combination of the segmentation model’s state calls and the read depth across cells (see (B) Extracted motifs agree with known motifs of transcription factors implicated in regulating distinct cell-type-specific processes. |

Accessibility dynamics are reflected in histone PTM states and 3D genome organization (A) Browser shot around the dre-mir-9-5 locus showing strong concordance between (from top to bottom) SHAMAN 3D interaction score heatmap, Cicero co-accessibility arcs for scores >0.28 (top 1% score cutoff; dashed line), histone PTM signals and promoter-like/enhancer-like HMM state calls, cluster-collapsed sci-ATAC-seq signals, sci-ATAC-seq segmentation calls, H3K36me3 signal, and nascent chromatin-associated RNA signal. Co-accessibility arcs are clearly enriched between strong interaction regions (orange/yellow in Hi-C heatmap), and these anchor points are clearly marked with enhancer-like and promoter-like PTMs, as captured by the histone PTM states. Co-accessibility is also observed in the sci-ATAC-seq signal tracks and reflected in the similar coloring of the sci-ATAC-seq segmentation calls. (B) A heatmap representing histone PTM chromatin states learned. Each state is a multivariate Gaussian distribution and is plotted as the mean scaled ChIP-seq signal for each PTM. (C) 1-kb segments from the sci-ATAC-seq foreground are classified for their most representative histone PTM state (see (D) Entropy scores (low = cell specific, high = constitutive) for foreground sci-ATAC-seq regions were split into deciles, and within each decile the number of regions for each type of histone PTM state was counted and plotted. (E) (F) (G) SHAMAN Hi-C interaction score means (full plot lines) or distributions (inset boxplots) are plotted for pairs of sci-ATAC-seq foreground regions that are >25-kb apart and within the same TAD. Region pairs are split first by Cicero co-accessibility score percentiles and then by having a promoter-like histone PTM state in one or both of the 2 regions (prom-cont), having no promoter-like histone PTM regions but having 1 or 2 enhancer-like PTM regions (enh-cont), or where neither region is promoter-like or enhancer-like (other). Mean lines for all 100 percentiles are plotted for ease of visualization, and boxplot insets for the 1st, 25th, 50th, 75th, or 100th percentiles are shown to give a better sense of the distributions. Counts for each group can be seen in |

Application of sci-ATAC-seq to npas4l embryos reveals unexpected cell-type-specific regulation (A) Representative images of npas4l wild-type/heterozygous and homozygous mutants at 24 hpf exhibiting fli1a:GFP expression. (B) UMAP representation of the cell-Topic matrix from cisTopic on 8,976 cells, 3,769 homozygous npas4l mutants, and 5,207 siblings. Percentages represent the proportion of mutant cells relative to all mutant and sibling cells per density cluster. (C) Summary chromatin accessibility from aggregated cells for each cluster (pseudo-bulks) at the npas4l locus. Three cell-type-specific peaks of accessibility are highlighted as putative enhancers enh1, enh2a, and enh2b ∼8–10 kb from the npas4l TSS. (D) Motif detection in the enh1, enh2a, enh2b sequences with JASPAR motifs.69 Motif scanning at the specific enhancer was with FIMO70 and the 20 highest enriched motif sequences are displayed, collapsed per family. Bold black represents a core sequence match shared across the whole family, and gray represents less frequent variations of the motif sequence. (E) Per-cell distribution of accessibility at putative npas4l enhancer enh1 (highlighted in C), represented in UMAP space. (F) Per-cell distribution of accessibility at putative npas4l enhancer enh2a and enh2b (highlighted in C), represented in UMAP space. (G) Enh1E1b:GFP expression at 24 hpf. (i, ii) Single plain optical cross-section through the axial vessels. Scale bars: 200 μm (A and G), 20 μm (i), 10 μm (ii). DA, dorsal aorta, PCV, posterior cardinal vein. |