
- Title
-
SLAMseq resolves the kinetics of maternal and zygotic gene expression during early zebrafish embryogenesis
- Authors
- Bhat, P., Cabrera-Quio, L.E., Herzog, V.A., Fasching, N., Pauli, A., Ameres, S.L.
- Source
- Full text @ Cell Rep.
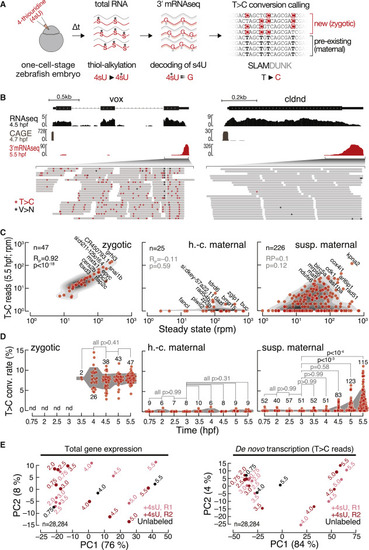
3′ mRNA SLAMseq in zebrafish embryos distinguishes zygotic from maternally deposited mRNA (A) Zebrafish embryos were injected with 4-thiouridine (4sU; 1.5 mM) at the 1-cell stage and development proceeded for a defined time (Δt), followed by total RNA preparation and SLAMseq employing 3′ mRNA sequencing. Zygotic transcripts were distinguished from maternal mRNAs by the presence of T>C conversions at sites of 4sU incorporation as identified by SLAMDUNK.21 (B) Representative genome browser screenshot of the zygotic gene ventral homeobox (vox; left) and the maternal gene claudin d (cldnd; right). Tracks for poly(A)-selected RNA-seq (top), cap analysis gene expression (CAGE; middle; remapped from Haberle et al.14), and 3′ mRNA SLAMseq (bottom), sampled at the indicated developmental stage (hours post-fertilization [hpf]), are shown. Zoom in shows individual reads of 3′ mRNA SLAMseq datasets mapping to the respective 3′ UTR counting windows. Asterisks indicate T>C conversions (T>C; red) or any other conversions (V>N; black). (C) Comparison of de novo transcription (T>C reads in reads per million [rpm]) and gene expression (in rpm) for pre-defined zygotic (n = 47), high-confidence (h.-c.; n = 25), and suspected (susp.; n = 226) maternal genes at 5.5 hpf. Pearson correlation coefficient (RP) and associated p values (p) are shown. (D) T>C conversion (conv.) rate for transcripts defined in (C) during MZT (time in hpf). Individual genes for which a confident average conversion rate could be derived from two independent biological replicates (red, n = number of genes) and interquartile range (gray area) are shown. p values (Kruskal-Wallis and Dunn’s multiple comparison test) are indicated; nd, not detected. (E) Principal-component analyses of unfiltered control (unlabeled; black) and two independent 3′ mRNA SLAMseq (+4sU; R1 light and R2 dark red) experiments at the indicated developmental time points (in hpf). Gene expression (left); de novo transcription (T>C reads) (right). The variance of each principal component is indicated in a percentage. n, number of genes considered for the analysis. |
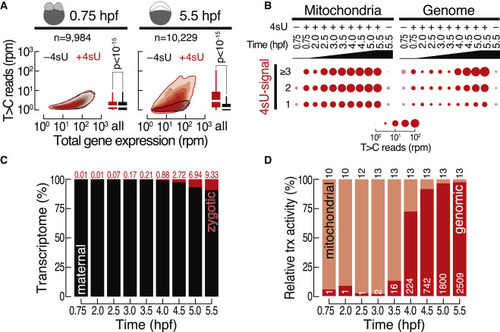
The transcriptional landscape in zebrafish embryogenesis (A) Comparison of de novo transcription (i.e., T>C reads in rpm) with gene expression (in rpm) in zebrafish embryos injected with 4sU (+4sU, red) or in untreated control embryos (−4sU, black) at the indicated developmental time points (in hpf). Boxplots show a quantitative comparison of de novo transcription signal by comparing T>C reads. p value (Wilcoxon test) is shown. n, number of inspected genes. (B) Balloon plots report number of reads (in rpm) containing one, two, or three and more T>C conversions mapping to the mitochondrial (left) or the nuclear genome (right). (C) Contribution of zygotic (red, percentage indicated on top) and maternal (black) transcripts to gene expression at the respective time points (hpf). (D) Relative transcriptional activity of the mitochondrial (light red) and nuclear genome (dark red). The number of genes for each category is indicated. |

Evidence for spurious transcription at hundreds of gene loci prior to MZT (A) T>C confidence score (PTC) reports the percentage of T>C conversions per 4sU-labeled transcript. Only genes that exhibit a PTC score corresponding to a true positive rate of >74.4% and false positive rate of 0% (see Figure S3A) are shown. Previously reported early transcribed genes are highlighted (red). n, number of genes. See also Table S2. (B) Venn diagrams report the overlap of genes detected above PTC cutoff in two independent biological replicates at the indicated time points (in hpf). p value is indicated (Fisher’s exact test, ∗∗∗∗p < 10−4). (C) Heatmap for all genes detected above PTC cutoff at 0.75 hpf (2-cell stage; n = 501) reports the presence of T>C reads (above PTC cutoff) in none (white), one (gray), or both (black) of two independent experiments at the indicated subsequent time points (in hpf). Genes with continuous (red) or discontinuous signal (blue) in at least one of two replicates are highlighted (left). (D) Median number of introns (left) or length of the coding sequence (CDS; in kilobases [kb]) for the indicated number of genes ranked by highest (filled circles) or lowest (open circles) PTC at 0.75 hpf. Statistically significant deviation (Wilcoxon test; ∗∗∗∗p < 10−4) from median (dashed line) and interquartile range (gray area) of all genes in the dataset is indicated. (E) Normalized enrichment scores (NES) of ATAC-seq (left; derived from Pálfy et al.9) and H3K27 acetylation chromatin immunoprecipitation sequencing (ChIP-seq) (right; derived from Bogdanović et al.25) for the indicated number of genes ranked by highest (red) or lowest (blue) PTC at 0.75 hpf. Significant enrichment (hypergeometric test with Benjamini-Hochberg correction; p < 0.05) is indicated in opaque colors. |
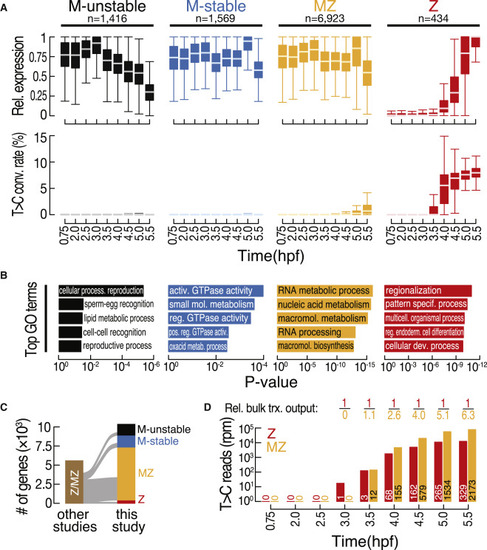
Classification of the zebrafish transcriptome during MZT reveals zygotic re-expression of most maternal genes (A) Classification of the transcriptome by k-medoids clustering (see Figure S4A) was based on gene expression (top) and T>C conversion rates (bottom) at the indicated developmental time points (in hpf). Only genes above expression cutoff (5 rpm) at any time point were considered. Genes (n) were classified into maternal unstable (M unstable; black), maternal stable (M stable; blue), maternal-zygotic (MZ; yellow), and zygotic (Z; red). Gene expression was calculated for each gene relative to the maximum observed expression. See also Table S3. (B) Top five Gene Ontology (GO) terms significantly enriched in each of the gene classes described in (A). (C) Sankey diagram reports a comparison of 3′ mRNA SLAMseq-based gene classifications (this study) with previously reported zygotic (i.e., zygotic or MZ) gene annotations.4,7,19 (D) Quantification of bulk zygotic expression (i.e., T>C reads in rpm) of zygotic (red) or MZ (yellow) genes at the indicated time points (in hpf). The number of genes considered at each time point is indicated. The relative (rel.) bulk transcriptional (trx.) output reports the relative abundance of T>C reads derived from all zygotic (red) or MZ (yellow) genes. |
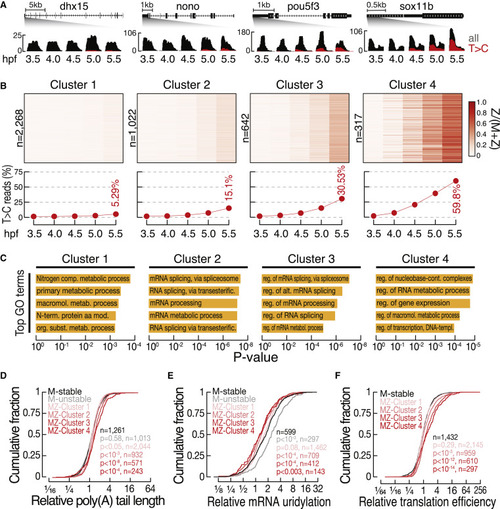
Replacement of MZ transcripts occurs at distinct rates that impinge on signatures of posttranscriptional control (A) Representative genome browser screenshots of MZ genes with constant abundance but distinct rates of zygotic replenishment. Zoom in to the 3′ end of genes shows total gene expression (all, gray) and zygotic expression (T>C, red) as determined at the indicated time points (in hpf). (B) Heatmap (top) shows the contribution of zygotic transcripts compared with total abundance (Z/[M + Z]) for the indicated number of genes (n) classified into four groups (clusters 1–4) by k-medoids clustering. The average contribution of zygotic expression to transcript abundances (bottom) and the maximum replacement at 5.5 hpf are indicated. See also Table S4. (C) Top five GO terms significantly enriched in each of the gene clusters described in (B). (D and E) Cumulative distribution of the change in poly(A)-tail length (D) and mRNA 3′ end uridylation (E) after vs. before ZGA (6 vs. 2 hpf), as measured by Chang et al.26 The indicated number of genes (n) classified into maternal-stable (black), maternal-unstable (gray), and MZ clusters (1–4, shades of red; see Figure 4) are shown. p values (Komogorov-Smirnov test) are indicated for comparisons of maternal-unstable with all other transcript categories. (F) Cumulative distribution of the change in translation efficiency post- (shield stage, ∼6 hpf) vs. pre-MZT (256 cell stage, ∼2.5 hpf). Translation efficiency was determined by Chew et al.27 The indicated number of genes (n) classified into maternal-stable (black), maternal-unstable (gray), and MZ clusters (1–4, shades of red; see Figure 4) are shown. p values (Komogorov-Smirnov test) are indicated for comparisons of maternal unstable with all other transcript categories. |

|