
- Title
-
Specificity of the innate immune responses to different classes of non-tuberculous mycobacteria
- Authors
- Hu, W., Koch, B.E.V., Lamers, G.E.M., Forn-Cuní, G., Spaink, H.P.
- Source
- Full text @ Front Immunol

Characterization of M. avium infection in zebrafish larvae compared to M. marinum infection. (A, B) Percent of survival curves for ABTL zebrafish larvae infected with a series of doses M. marinum Mma20 or M. avium MAC 101. ABTL zebrafish larva infected with mCherry-labeled M. marinum Mma20 at a dose of ~250 CFU and infected with wasabi-labeled M. avium MAC 101 at a dose of ~4500 CFU or 9000 CFU by caudal vein infection at 28 hpf. (C) Representative images for the bacterial burden quantification were taken at 4 dpi. Scale bar: 50 µm. (D) Bacterial burden quantification of ABTL zebrafish larvae upon ~250 CFU Mma20 infection. (E) Bacterial burden quantification of ABTL zebrafish larvae upon ~4500 CFU MAC 101 infection. (F) Bacterial burden quantification of ABTL zebrafish larvae upon ~9000 CFU MAC 101 infection. (G, H) Representative CLSM images of Tg(mpeg1: EGFP)gl22 zebrafish larvae infected with mCherry-labeled Mma20 strain (G) or DsRed-labeled MAC 101 (H). Tg(mpeg1: EGFP)gl22 embryos were infected ~250 CFU Mma20 mCherry strain or ~4500 CFU MAC 101 DsRed strain at 28 hpf. CLSM images were taken for the 4 dpi infected larvae by using 40 times magnification lens (oil immersion, N.A. 1.3). Scale bar: 50 µm. (I) TEM pictures showing a sagittal section through MAC 101 in wild type zebrafish larva. Red arrows represent the bacteria inside of a phagocyte. Scale bar: 1 µm. In (A, B) data were collected from three pools of zebrafish larvae. In (D, E, and F) data (mean ± SD) were combined from three pools of zebrafish larvae. Statistical significance of differences was determined by using one-way ANOVA with Tukey’s multiple comparison test as a post-hoc test. *P < 0.05, **P < 0.01, ***P < 0.001, ****P < 0.0001. Sample size (n): 24, 24, 23, 24 (D), 31, 33, 31, 30 (E), 30, 29, 27, 29 (F). |

Quantification of bacterial burden in tlr2 zebrafish larvae with M. marinum or M. avium infection. Tlr2+/+ and tlr2−/− embryos were infected at 28 hpf by caudal vein infection with mCherry-labeled M. marinum strain Mma20 at a dose of ~ 250 CFU, or infected with ~ 4500 CFU wasabi-labeled M. avium strain MAC 101. (A) Representative images of tlr2+/+ and tlr2−/− embryos infected with mCherry-labeled M. marinum strain Mma20 at 4 dpi. (B, C) Quantification of bacterial burden of tlr2+/+ and tlr2−/− upon Mma20 infection at 1 dpi and 4 dpi. (D) Representative images of tlr2+/+ and tlr2−/− embryos infected with wasabi-labeled M. avium strain MAC 101 at 4 dpi. (E, F) The bacterial burden of tlr2+/+ and tlr2−/− upon MAC 101 infection were quantified at 1 dpi and 4 dpi. In (B, C, and E, F) data (mean ± SD) were combined from three independent experiments. Statistical significance of differences was determined by unpaired t-test for comparison between the tlr2 mutant and wild type group. ns, non-significant; *P < 0.05, **P < 0.01. Scale bar: 50 µm. Sample size (n): 64, 78 (B), 54, 72 (C), 54, 50 (E), and 45, 45 (F). |
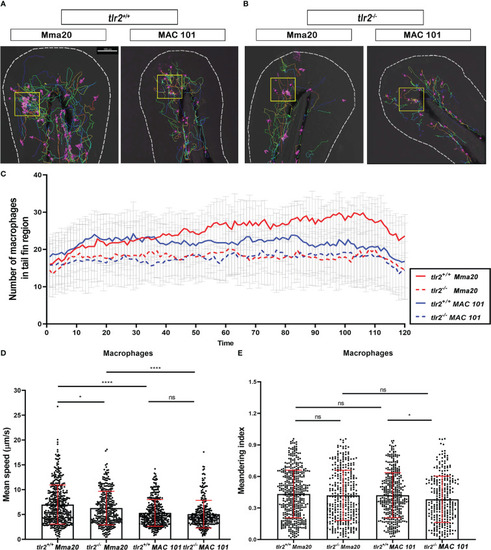
Quantification of macrophages behavior in tlr2 mutant and wild type control larvae after M. marinum Mma20 or M. avium MAC 101 tail fin infection. (A, B) Representative images of macrophage tracks in tlr2+/+ or tlr2-/- larvae with Mma20 or MAC 101 tail fin infected. The magenta balls represent the tracked macrophages, the yellow box indicates the infected area. (C) The number of recruited macrophages to the tail fin region upon Mma20 or MAC 101 infection. The curves represent the mean value of the recruited macrophage numbers at different time points. (D) The mean speed of individual tracked macrophages in the tail fin region. (E) The meandering index of tracked macrophages in the tail fin region. In (D, E) data (mean ± SD) were combined from three independent experiments with 5 fish in each group. Two-way ANOVA with Tukey’s multiple comparison test as a post-hoc test. ns, non-significant; *P < 0.05, ****P < 0.0001. Scale bar: 100 µm; Sample size (n): 447, 343, 372, 290 (D, E). |

Quantification of neutrophils behavior in tlr2 mutant and wild type control larvae after M. marinum Mma20 or M. avium MAC 101 tail fin infection. (A, B) Representative images of neutrophil tracks in tlr2+/+ or tlr2-/- larvae with Mma20 or MAC 101 tail fin infected. The cyan balls represent the tracked neutrophils, the yellow box indicates the infected area. (C) The number of recruited neutrophils to the tail fin region upon Mma20 or MAC 101 infection. The curves represent the mean value of the recruited neutrophil numbers at different time points. (D) The mean speed of individual tracked neutrophils in the tail fin region. (E) The meandering index of tracked neutrophils in the tail fin region. In (D, E) data (mean ± SD) were combined from three independent experiments with 5 fish in each group. Two-way ANOVA with Tukey’s multiple comparison test as a post-hoc test. ns, non-significant; *P < 0.05, **P < 0.01, ***P < 0.001, ****P < 0.0001. Scale bar: 100 µm; Sample size (n): 217, 254, 228, 179 (D, E). |

Global transcriptome analysis of M. marinum Mma20 vs PBS and M. avium MAC 101 vs PBS groups. (A) Experimental scheme to collect samples for RNA deep sequencing. AB/TL zebrafish embryos were injected with ~250 CFU M. marinum Mma20 strain or ~4500 CFU M. avium MAC 101 strain at 28 hpf. The embryos in the control group were injected with sterile PBS with 2% PVP. The samples for RNAseq are taken from four independent sample sets with the injected larvae at 4 dpi. (B) Principal component analysis. The RNAseq samples clustered based on their groups, as showed by the solid ellipses grouping samples. (C) Overview of the distribution of DEGs fold change in zebrafish larvae infected with Mma20 or MAC 101. DEGs were assessed by FDR p-value < 0.05. Upregulated gene sets are shown in red and downregulated gene sets are shown in blue. The intensity of the color represents the fold change level. (D) Venn diagram shows the common and specific DEGs number between the 250 CFU Mma20- infected group and 4500 CFU MAC 101- infected group compared to the control. The Venn diagrams were made by the website: https://www.biovenn.nl/. (E) The top 10 gene ontology (GO) terms of biological process with lowest P value in the Mma20- infected larvae compared to the control group. (F) The top 10 GO terms of biological process with lowest P value in the MAC101-infected larvae compared to the control group. (G) Top 20 significantly enriched KEGG pathways in the Mma20- infected larvae compared to the control group. (H) Top 20 significantly enriched KEGG pathways in the MAC 101- infected larvae compared to the control group. The GO analysis and KEGG pathway enrichment analysis were performed by using DAVID. In (G, H), the size of circle represents the enriched gene numbers, bigger circle indicates more enriched genes were found in this pathway. The color of circle represents -log10 (P value). |

Common and specific gene expression profiles of larvae infected with M. marinum Mma20 or M. avium MAC 101. DEGs from the Mma20- infected and the MAC 101- infected groups compared to the control group are showing in (A) Cytokine and cytokine receptor interaction; (B) Phagosome; (C) Matrix remodeling; (D) Autophagy regulator; (E) Apoptosis; (F) Metabolic pathway; In the visualization, the gene expression in the comparison of the Mma20- infected and the MAC 101- infected compared to the control group are depicted by color (red, upregulated genes in Mma20- infected group; blue, downregulated genes in Mma20- infected group; Magenta, upregulated genes in MAC 101- infected group; Cyan, downregulated genes in MAC 101- infected group. FDR p-value < 0.05). |