FIGURE SUMMARY
Title

SARS-COV-2 spike protein promotes RPE cell senescence via the ROS/P53/P21 pathway

Authors
Zhang, Y., Peng, X., Xue, M., Liu, J., Shang, G., Jiang, M., Chen, D., Liu, B., Wang, Y., Jia, X., Xu, J., Zhang, F., Hu, Y.
Source
Full text @ Biogerontology

SARS-CoV-2 S-protein inhibits ARPE-19 cell proliferation in vitro. A Immunoblot of ACE2 and β-actin in ARPE-19 or HA-ACE2-overexpressed ARPE-19 cells. B Real-time cell analyzer (RTCA) detection of cell proliferation of ARPE-19 cells (wt), S-protein-treated ARPE-19 cells (B), or Flag-S overexpressed ARPE-19 cells (D). C and E Flow cytometry measurement of the cell cycle of ARPE-19 cells (wt), S-protein-treated ARPE-19 cells (+ S-protein), or Flag-S-overexpressed ARPE-19 cells (Flag-S). The black, gray and blank rectangles represent G1, S, and G2 phases respectively. The data represent mean ± SD, n = 3. Unpaired Student’s T-test was used for statistical analysis. *p < 0.05

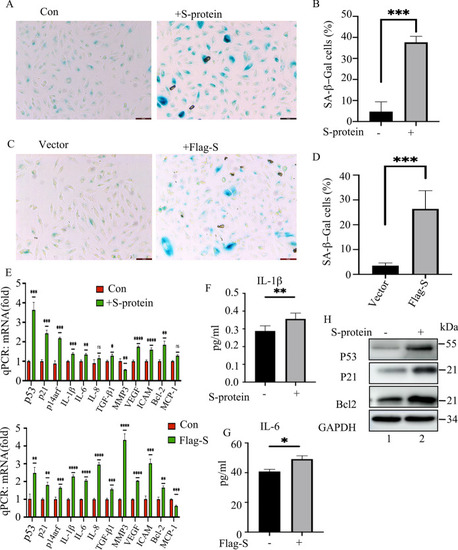
S-protein induces senescence of ARPE-19 cells. A SA-β-Gal staining of ARPE-19 cells that were treated with media containing PBS (Con) or S-protein for 48 h. B Quantitation of the percentage of SA-β-Gal positive cells per view in A. Ten views were used for quantitation, and the experiment was repeated three times. The data represent mean ± SD, n = 3, ***p < 0.001. C SA-β-Gal staining of the ARPE-19 cells that express empty vector or p3xFlag-S respectively for 48 h. D Quantitation of the percentage of SA-β-Gal positive cells/ total cells/view (a total of 10 views were used for quantitation). The data represent mean ± SD (n = 3), ***p < 0.001. E qPCR to quantitate the expression of cell cycle inhibitors (P53, p21, and p14arf), cytokines (IL-1β, IL-6, IL-8, MCP-1, TGF-β1), MMP3, and iCAM in the cells treated in A and C. F and G ELISA to measure the secretion of IL-1β and IL-6 in ARPE-19 cells that were treated with S-protein for 48 h. H Immunoblot of the expression of p53, p21, Bcl-2, and GAPDH in ARPE-19 cells that were treated with S-protein for 48 h

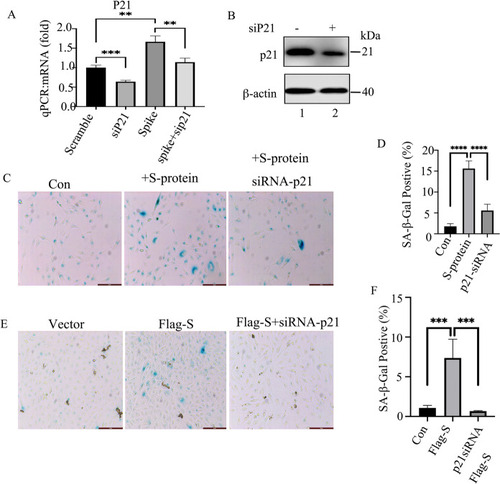
Knocking down p21 by siRNA reduces S-protein-induced cell senescence. A qPCR to measure the expression of p21 in ARPE-19 cells expressing scramble siRNA or siRNA to P21 followed by treatment with S-protein for 48 h. The data represent mean ± SD, (n = 3), **p < 0.01, ***p < 0.001. B Immunoblot of p21 in ARPE-19 cells that expressed scrambled siRNA or siRNA against p21. C SA-β-Gal stain in ARPE-19 cells that were transfected with scramble or siRNA-P21 followed by treatment with S-protein for 72 h. D Quantitation of the percentage of SA-β-Gal positive cells vs total cell number per view in C. The data represent mean ± SD, (n = 3), **p < 0.01, ***p < 0.001. E SA-β-Gal stain assay, ARPE-19 cells were transfected with empty vector, Flag-S and Flag-S + siRNA-P21 for 72 h. F Quantitation of the percentage of SA-β-Gal positive cells vs total cell numbers per view in E. The data represent mean ± SD, (n = 3), ***p < 0.001

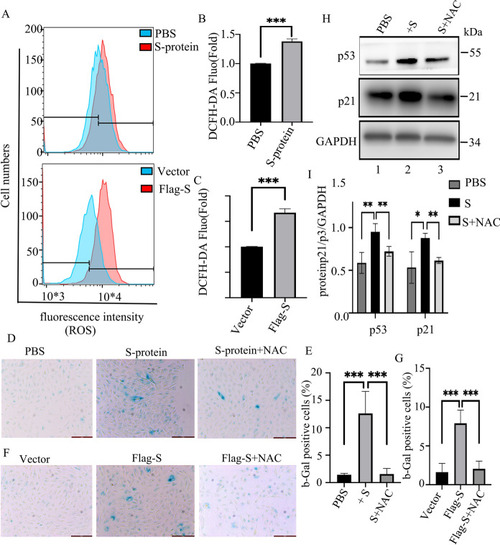
Removing ROS by NAC down-regulates S-protein-induced senescence of ARPE-19 cells. A Flow cytometry assay measuring DCFH-DA-degenerated fluorescence level in ARPE-19 cells that were treated with S-protein for 24 h (upper panel) or transfected with plasmid p3xFlag-S (lower panel). B and C Quantitation of DCFH-DA fluorescence in A. The data represent mean ± SD (n = 3), ***p < 0.001. D SA-β-Gal stain of ARPE cells that were treated with S-protein or S-protein + NAC for 48 h. E Quantitation of the percentage of SA-β-Gal positive cells in D. The data represent mean ± SD (n = 3), ***p < 0.001. F SA-β-Gal stain of ARPE-19 cells that were transfected with p3xflag-S followed by NAC treatment for 48 h. G, Quantitation of percentage of SA-β-Gal positive cells in F. The data represent means ± SD (n = 3), ***p < 0.001. H, immunoblot the expression of P53, P21 and GAPDH in ARPE-19 cells that were treated with media containing PBS (lane 1), S-protein (lane 2) and S-protein + NAC (lane 3)

S-protein induces ER stress in ARPE-19 cells. A and B Immunofluorescence staining of S-protein in S-protein-treated (B) or Flag-S overexpressed ARPE-19 cells (A) that were transfected with pDs-Red-KDEL. C Immunoblot of the expression of CHOP, BIP, Calnexin, ATF3, ATF4, ATF6, and β-actin in ARPE-19 cells treated with S-protein or treated with S-protein S-protein + NAC for 24 h. D Densitometry quantitation of those proteins in C. The data represent mean ± SD (n = 3), *p < 0.05, **p < 0.01

S-protein activates NF-κB pathways in ARPE-19 cells. A Immunofluorescence staining of p65 protein in S-protein-treated or Flag-S-overexpressed ARPE-19 cells. The nuclei were stained with DAPI. The scale bar represents 20 μm. B Cytosol-Nucleus fraction assay to determine the localization of p65 in ARPE-19 cells that were treated with PBS (Con) or S-protein for 48 h. BrgI and GAPDH were used as nuclear and cytosolic markers respectively. C Immunoblot of iκb and GAPDH in ARPE-19 cells that were treated with sham, S-protein and S-protein + NAC respectively. D Densitometry quantitation of iκb vs GAPDH in C. The data represent mean ± SD (n = 3), *p < 0.05. E Immunoblot of the expression of p53, p21 and GAPDH in ARPE-19 cells that were treated with sham, S-protein and S-protein + Bay-11–7082 (NF-κB inhibitor) for 24 h. F Densitometry quantitation of P53 and p21 in E. The P53 and P21 protein level was normalized to GAPDH. The data represent mean ± SD (n = 3), *p < 0.05. G qPCR measuring the expression of p53, p14arf, IL-1β, IL-6, TGF-β1 and iCAM in ARPE-19 cells treated in E. The data represent mean ± SD (n = 3), **p < 0.01, ***p < 0.001

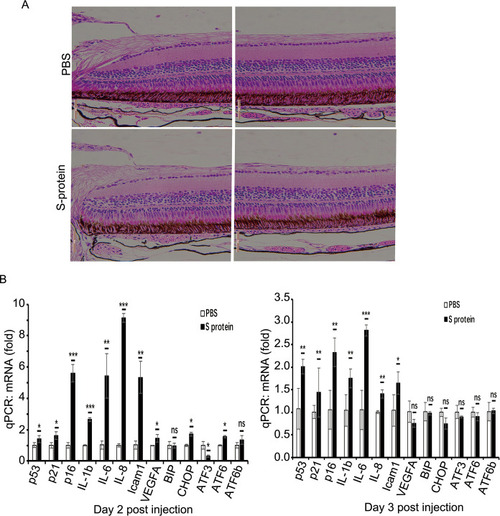
S-protein induces the expression of senescence-associated factors in the zebrafish retina. A H&E analysis of day 2 zebrafish retina post injection of PBS or 6.3 ng S-protein. B Quantitative RT-PCR measuring the expression of P53, P21, P16, IL-1β, IL-6, IL-8, ICAM1, VEGF-A, BIP, CHOP, ATF3, ATF6 in day 2 and day 3 recovered zebrafish retina post injection of S-proteins. The data showed mean ± SD, n = 6. The unpaired student t-test was used for statistical analysis. *p < 0.05, **p < 0.01

Acknowledgments
This image is the copyrighted work of the attributed author or publisher, and ZFIN has permission only to display this image to its users. Additional permissions should be obtained from the applicable author or publisher of the image. Full text @ Biogerontology