
- Title
-
Triclocarban triggers osteoarthritis via DNMT1-mediated epigenetic modification and suppression of COL2A in cartilage tissues
- Authors
- Zhang, Y., He, L., Yang, Y., Cao, J., Su, Z., Zhang, B., Guo, H., Wang, Z., Zhang, P., Xie, J., Li, J., Ye, J., Zha, Z., Yu, H., Hong, A., Chen, X.
- Source
- Full text @ J. Hazard. Mater.

Fig. 1. TCC induces hyperaemia in the joint of the zebrafish anal fin. (A) Typical images reveal that TCC induces hyperaemia in the reciprocal of the zebrafish anal fin in a time- and dose-dependent manner. The zebrafish were soaked in 0.03–3 μM TCC for different periods, and the same dose of DMSO (0.025 %, V/V) was employed as a control. The black arrows point to the hyperaemia area, and the number in the frame refers to the number of zebrafish as shown in the image/total number of zebrafish involved in this group. Experiments were performed three times with similar results. (B) Quantification of the hyperaemia in the joint of the zebrafish anal fin according to the virtual ruler in the software of the imaging system. L0 represents the length of the whole anal fin, while Lh represents the length of the hyperaemia area. The hyperaemia rate is presented as 100 % X (Lh/L0); (C) Quantification of the time- and dose-dependent hyperaemia in the joints of zebrafish anal fins induced by TCC. * indicates P < 0.05, * * indicates P < 0.01, * ** indicates P < 0.001, * ** * indicates P < 0.0001. The comparison was performed between the TCC-treated group and the DMSO (0.025 %, V/V) control at the same time point. |
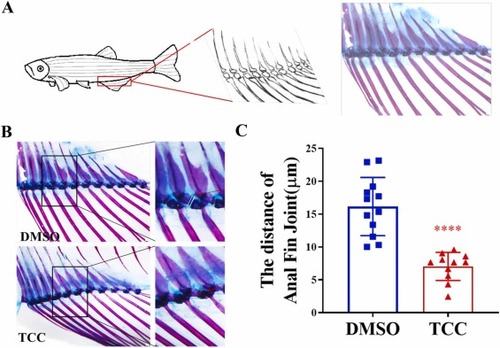
Fig. 2. TCC reduces the joint space of the zebrafish anal fin. (A) Scheme of Alcian blue and alizarin red staining of zebrafish treated with TCC. Zebrafish were treated with 3 μM TCC or and equal concentration of DMSO (0.025 %, V/V) as a control for three weeks before staining. (B) Typical images of the zebrafish anal fin with Alcian blue and alizarin red staining reveal that TCC reduces the joint space of the zebrafish anal fin. The intraarticular space was quantified by the virtual ruler in the imaging system, which was precalibrated by a physical ruler. (C) Quantification of the joint space of the zebrafish anal fin treated with 3 μM TCC or an equal concentration of DMSO (0.025 %, V/V). * ** * refers to P < 0.0001 and n = 12. |

Fig. 3. TCC causes metabolic dysfunction in the joint of the zebrafish anal fin. (A) Heatmap revealing the differential metabolites collected in positive ion mode; (B) Heatmap showing the differential metabolites collected in negative ion mode; (C) Principal component analysis (PCA) of the differential metabolites collected in positive ion mode; (D) Partial least squares-discriminant analysis (PLS-DA) of the differential metabolites collected in positive ion mode; (E) PCA of the differential metabolites collected in negative ion mode; (F) PLS-DA of the differential metabolites collected in negative ion mode; (G) Kyoto Encyclopedia of Genes and Genomes (KEGG) enrichment for the differential metabolites collected in positive and negative ion modes. |

Fig. 4. TCC reprograms the transcriptome of the zebrafish anal fin joint by reducing the extracellular matrix. (A) Heatmap of the differentially expressed genes treated with TCC. (B) Multiple GSEA curves of subsets of genes encoding the extracellular matrix. (C) Distribution of genes within the GO term of collagen trimer according to GSEA analysis; (D) Heatmap revealing the changes in the expression of extracellular matrix- and inflammation-related genes after exposure to TCC. |

Fig. 5. TCC suppresses the expression of the type II collagen coding gene via DNMT1. (A) Different concentrations of TCC reduced type II collagen in human chondrocytes, as indicated by Sirius red staining. The experiments were performed with 3 biological replicates. An equal concentration of DMSO (0.025 %, V/V) was used as control. Similar results were obtained in human chondrocytes from 6 independent donors (3 female donors and 3 male donors). (B) Quantification of Sirius red staining in human chondrocytes exposed to different concentrations of TCC or an equal concentration of DMSO (0.025 %, V/V). Columns with the same letter indicate P > 0.05, while columns with different letters indicate P < 0.05. (C) TCC reduces COL2A1 expression in human chondrocytes. qPCR was performed with 3 biological replicates and 2 technical replicates. Similar results were obtained in human chondrocytes from 6 independent donors. An equal concentration of DMSO (0.025 %, V/V) was used as control. Columns with the same letter indicate P > 0.05, while columns with different letters indicate P < 0.05. (D) TCC reduces type II collagen in human chondrocytes. Western blotting was performed with 3 biological replicates, and similar results were obtained in human chondrocytes from 6 independent donors. GAPDH was employed as a loading control. (E) TCC stimulates DNMT1 expression in human chondrocytes. qPCR was performed with 3 biological replicates and 2 technical replicates. Similar results were obtained in human chondrocytes from 6 independent donors. Columns with the same letter indicate P > 0.05, while columns with different letters indicate P < 0.05; (F) GO enrichment of the differentially expressed genes in the zebrafish anal fin joint treated with TCC; (G) Distribution of genes within the GO term of negative regulation of gene expression according to GSEA; (H) Distribution of genes within the GO term of DNA metabolic processes according to GSEA. |

Fig. 6. TCC reduces type II collagen expression via DNMT1-dependent DNA methylation. (A) The CpG island in the human COL2A1 gene. The arrows refer to the primer pairs. (B) The CpG island in the zebrafish col2a1a gene. The arrows refer to the primer pairs; (C) Quantification of CpG island methylation in the human COL2A1 gene treated with TCC or an equal concentration of DMSO (0.025 %, V/V).; (D) Quantification of CpG island methylation in the zebrafish col2a1a gene treated with TCC or an equal concentration of DMSO (0.025 %, V/V).; (E) Quantification of CpG island methylation in the human COL2A1 gene exposed to TCC with or without the presence of DC_517 or CM-272. An equal concentration of DMSO (0.025 %, V/V) was used as control; (F) Quantification of COL2A1 expression in human chondrocytes exposed to TCC with or without the presence of DC_517 or CM-272. An equal concentration of DMSO (0.025 %, V/V) was used as control. UP refers to unmethylation primers; MP refers to methylation primers. qPCR was performed with 3 biological replicates and 2 technical replicates. Similar results were obtained in human chondrocytes from 6 independent donors. * indicates P < 0.05, * ** indicates P < 0.001, and * ** * indicates P < 0.0001. |
Reprinted from Journal of hazardous materials, 447, Zhang, Y., He, L., Yang, Y., Cao, J., Su, Z., Zhang, B., Guo, H., Wang, Z., Zhang, P., Xie, J., Li, J., Ye, J., Zha, Z., Yu, H., Hong, A., Chen, X., Triclocarban triggers osteoarthritis via DNMT1-mediated epigenetic modification and suppression of COL2A in cartilage tissues, 130747130747, Copyright (2023) with permission from Elsevier. Full text @ J. Hazard. Mater.