
- Title
-
VGLL2-NCOA2 leverages developmental programs for pediatric sarcomagenesis
- Authors
- Watson, S., LaVigne, C.A., Xu, L., Surdez, D., Cyrta, J., Calderon, D., Cannon, M.V., Kent, M.R., Silvius, K.M., Kucinski, J.P., Harrison, E.N., Murchison, W., Rakheja, D., Tirode, F., Delattre, O., Amatruda, J.F., Kendall, G.C.
- Source
- Full text @ Cell Rep.

A zebrafish model of human VGLL2-NCOA2-driven tumorigenesis
(A) Zebrafish were injected at the one-cell stage with plasmid DNA carrying the human fusion gene VGLL2-NCOA2 driven by the CMV promoter and tagged with GFP2A, and Tol2 transposase mRNA to stably integrate the construct. The GFP+ embryos were tracked from 1 to 12 months for tumor formation. (B) Tumor incidence curve of one independent experiment showing n = 108 adult fish injected with CMV-GFP2A-VGLL2NOCA2 compared with n = 42 adult sibling fish injected with CMV-GFP2A-pA and log rank (Mantel-Cox) test performed with p < 0.0001. All fish that survived past 30 days of age are included. This experiment was repeated in three independent cohorts, with similar tumor incidence curves (data not shown). (C) Distribution of CMV-VGLL2NCOA2 tumors classified by location as depicted on the inset fish schematic. (D) Tumor onset curve for fish with a CMV-VGLL2NCOA2-driven tumor, stratified by location on the fish as defined in (C). Log rank (Mantel-Cox) analysis showed significant difference between the tumor onset of ventral tumors and all other tumors (p = 0.0479). (E) Representative CMV-VGLL2NCOA2-injected fish with tumors classified by location. For each fish, brightfield and GFP fluorescent images are overlaid and shown above the H&E stain of a transverse section through the GFP+ area. The top left text is the unique fish identification number, and the top right is the age of the fish when the tumor was resected. Scale bars for GFP and brightfield overlay, 2 mm. Scale bars for H&E and H&E inset, 500 and 100 mm, respectively. (F) High-magnification images (100× objective) of H&E stain of transverse sections through representative tumors from the tail, back, and ventral regions. Scale bars, 50 µm. |

Zebrafish VGLL2-NCOA2 tumors recapitulate the human disease
(A) Transverse sections through the GFP+ tumors were stained with H&E, and the subsequent step section stained with a human anti-NCOA2 antibody to detect the VGLL2-NCOA2 fusion. All n = 9 zebrafish tumors stained were positive. A transverse section was taken through a control wild-type zebrafish, and shown are the H&E and subsequent anti-NCOA2 antibody stain. Scale bars, 500 µm. (B) Representative RNAscope of transverse sections from wild-type zebrafish (portraying normal skeletal muscle expression) or zebrafish with VGLL2-NCOA2 tumors showing expression of myod1, myog, or desma (green), Pcna (purple), or DNA (blue). Scale bars, 50 µm. Five wild-type or tumor samples were assessed in total, with results presented in Table S3. (C) RNA-seq data of zebrafish VGLL2-NCOA2 tumors (n = 18) and mature skeletal muscle (n = 7) were compared with their human counterpart (VGLL2-NCOA2 tumors n = 5 from Watson et al.4 and mature skeletal muscle n = 803 from GTEx version 8) in an AGDEX analysis. Plotted in blue and red are genes that are shared as differentially expressed between the zebrafish and human VGLL2-NCOA2 tumors. The statistics of the AGDEX analysis are shown in the bottom right, as well as the p value generated by permutation analysis of randomly sampled data. (D) Gene set enrichment analysis associated with the n = 6,348 genes upregulated or n = 4,313 downregulated in (C). Plotted is the normalized enrichment score for each sub-ontology. |

Gene expression profiles of VGLL2-NCOA2 zebrafish tumors cluster with developmental time points
(A) Principal-component analysis (PCA) of RNA-seq data of zebrafish development time points from White et al. 26 and VGLL2-NCOA2 zebrafish tumors from this study. All FASTQ files were processed by the same computational pipeline to minimize computational batch effects. Colors indicate location of the tumor on the fish: back tumors in orange, ventral tumors in blue, head tumors in green, and tail tumors in purple. In the PCA, principal component 1 (PC1) describes the most variance but is presented to appreciate differences in PC2, which best discriminates tumor cohorts. (B) Embryonic stages labeled as per the Zebrafish Information Network (ZFIN). (C) Brightfield and GFP overlaid images of a subset of the VGLL2-NCOA2 tumors used in (A). Scale bars, 2 mm. |

VGLL2-NCOA2 reactivates developmental genes in zebrafish, mouse allograft, and human tumors
RNA-seq was performed on n = 18 zebrafish VGLL2-NCOA2 tumors, n = 7 adult zebrafish mature skeletal muscle samples, and n = 3 pooled samples of larval zebrafish from segmentation time points at 1–4 somites, 14–19 somites, and 20–25 somites (10.33, 16, and 19 h post fertilization at 28°C, respectively). (A) Venn diagram depicting the genes differentially regulated in the developmental time points and tumors compared with mature skeletal muscle, with n = 27 genes differentially regulated in both tumors and development. A false discovery rate (FDR) of 0.01 was used for genes to be included in this analysis. (B) Plot of FPKM values from n = 8 genes downregulated in developmental time points and tumors compared with mature skeletal muscle. The error bars represent the mean ± SD. (C) Plot of FPKM values from n = 19 genes upregulated in developmental time points and tumors compared with mature skeletal muscle. The error bars represent the mean ± SD. (D) Comparison of the expression of these 27 developmental genes in a mouse VGLL2-NCOA2-driven allograft model. Plotted is the fold change of these 27 genes in VGLL2-NCOA2 zebrafish tumors (n = 18) compared with mature skeletal muscle (n = 7), and in C2C12-VGLL2NCOA2 mouse allografts (n = 8) compared with mature skeletal muscle (n = 20; NCBI BioProjects PRJNA625451,28 PRJNA608179,29 PRJNA819493, PRJNA81315330). If the gene is red, it is statistically significant, and, if it is blue, it is not statistically significant in the mouse context. (E) Comparison of the expression of these 27 developmental genes in human VGLL2-NCOA2 tumors. Plotted is the fold change of these 27 genes in VGLL2-NCOA2 zebrafish tumors (n = 18) compared with mature skeletal muscle (n = 7), and in human VGLL2-NCOA2 tumors (n = 5; Watson et al.4) compared with mature skeletal muscle (n = 803; GTEx version 8). If the gene is red, it is statistically significant, and, if it is blue, it is not statistically significant in the human context. An FDR of 0.1 was used for genes to be included in the analysis in (D) and (E). |

Zebrafish VGLL2-NCOA2 tumors express Arf6 protein
(A) qRT-PCR of arf6a and arf6b levels using an independent cohort of n = 6 zebrafish tumors, n = 4 zebrafish mature skeletal muscle samples, and n = 4 pools of zebrafish embryos at a developmental time point of 20 h post fertilization. Each data point is an individual tumor or normal tissue sample. The error bars represent the mean ± SD. The p values were calculated using a one-way ANOVA followed by Tukey’s multiple comparisons post hoc test. (B) Western blot for Arf6 protein. For each group, protein lysate was loaded from pools of developing wild-type embryos (n = 12 embryos per pool) or 25 µg of lysate from mature skeletal muscle or VGLL2-NCOA2 tumors. Loading consistency is verified by Coomassie staining. Quantification is performed by normalizing Arf6 to total protein as determined by Coomassie. Each plotted data point is a biological replicate. The error bars represent the mean ± SD. The p values were calculated using a one-way ANOVA followed by Tukey’s multiple comparisons post hoc test. (C) Representative images of VGLL2-NCOA2 zebrafish tumors shown as brightfield overlaid with GFP fluorescence (scale bars, 2 mm), with serial transverse sections stained with H&E, an anti-NCOA2 antibody, and an anti-ARF6 antibody (scale bars, 500 µm). All n = 8 zebrafish tumors stained for Arf6 were positive. |
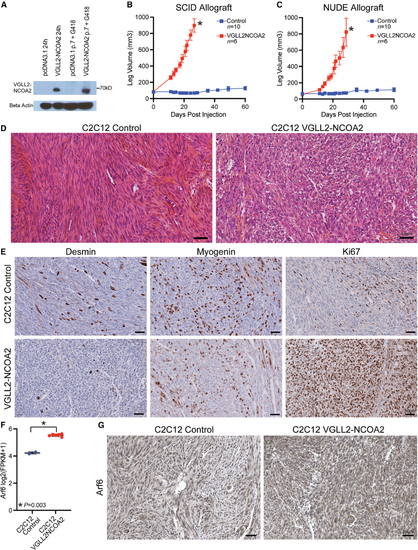
VGLL2-NCOA2 is transforming in mouse myoblast allograft models
(A) C2C12 mouse myoblasts transfected with human VGLL2-NCOA2 express the VGLL2-NCOA2 fusion protein 24 h post transfection and stably after passaging and selection in growth medium with G418 compared with a C2C12-pcDNA3.1 empty control. (B) Allograft leg volume of C2C12-pcDNA3.1 control and C2C12-VGLL2NCOA2 after intramuscular injection into the leg of SCID mice. C2C12-pcDNA3.1 control was injected in n = 10 allografts and C2C12-VGLL2NCOA2 was injected in n = 6 allografts. The error bars represent the mean leg volume ± SEM. Error bars are not shown if it is within the boundaries of the symbol. Leg volume at time points were compared using a Mann-Whitney U test corrected for multiple comparisons using the Benjamini, Krieger, and Yekutieli method. *p < 0.0005. Every time point after zero is statistically significant. (C) Allograft leg volume of C2C12-pcDNA3.1 control and C2C12-VGLL2NCOA2 after intramuscular injection into the leg of Swiss Nude mice. C2C12-pcDNA3.1 was injected in n = 10 allografts and C2C12-VGLL2NCOA2 was injected in n = 6 allografts. The error bars represent the mean leg volume ± SEM. Error bars are not shown if they are within the boundaries of the symbol. Tumor volume at time points were compared using a Mann-Whitney U test corrected for multiple comparisons using the Benjamini, Krieger, and Yekutieli method. *p < 0.0005. Every time point after zero is statistically significant. (D) Representative hematoxylin-eosin saffron (HES) staining from a C2C12-pcDNA3.1 control allograft and a C2C12-VGLL2NCOA2 tumor allograft. Scale bars, 50 µm. (E) Representative immunohistochemistry for Desmin, Myogenin, and Ki67 for C2C12-pcDNA3.1 control allograft and a C2C12-VGLL2NCOA2 tumor allograft. Scale bars, 50 µm. (F) Arf6 mRNA levels from RNA-seq of allografts from Swiss Nude mice, including two C2C12-pcDNA3.1 controls and six C2C12-VGLL2NCOA2 tumors. Error bars represent mean ± SD. Arf6 mRNA expression was compared using a Welch’s t test. (G) Representative immunohistochemistry for Arf6 protein levels in C2C12-pcDNA3.1 controls and C2C12-VGLL2NCOA2 tumors. Eleven C2C12-pcDNA3.1 controls and six C2C12-VGLL2NCOA2 tumor samples were analyzed. Results are presented in Table S4. Scale bars, 50 µm. |

Genetic cooperation of VGLL2-NCOA2 and ARF6 for sarcomagenesis
(A) Monoclonal C2C12 populations with stable Arf6 knockout were generated with CRISPR-Cas9 and guides targeting Arf6. Wild-type or Arf6 knockout cells were transfected with pCDNA3.1 empty control or pcDNA3.1 expressing VGLL2-NCOA2 under control of the CMV promoter. Shown is a western blot of generated C2C12 cell lines indicating VGLL2-NCOA2 fusion expression, Arf6 expression, and Tubulin as a loading control. (B) qRT-PCR for Myh1 expression relative to loading controls, Gapdh and Rpl27, for days 0, 2, and 6 of myogenic fusion. Each data point is a biological replicate. The error bars represent the mean ± SD. The p values were calculated using a one-way ANOVA followed by Tukey’s multiple comparisons post hoc test. This was repeated once. (C) Representative brightfield images of myotube morphology taken on day 6 of fusion for each treatment group. Scale bar, 100 µm. (D) Representative brightfield images of colonies in soft agar taken on day 14 post plating for each treatment group. Scale bar, 100 µm. (E) Quantification of the number of colonies per well on a six-well plate. Each data point is a biological replicate. The error bars represent the mean ± SD. The p values were calculated using a one-way ANOVA followed by Tukey’s multiple comparisons post hoc test. This was repeated twice. (F) ARF6 expression determined by RNA-seq in human mature skeletal muscle (n = 396; GTEx) and VGLL2-NCOA2 tumors from Watson et al.4 (n = 5; one is a primary and recurrent from the same patient). Each data point is an individual tumor or normal tissue sample. The error bars represent the mean ± SD. The p values were calculated using the Mann-Whitney U test. (G) ARF6 expression from (F) and compared with additional sarcoma tumor samples, including adult sarcoma from The Cancer Genome Atlas (TCGA) (n = 264), clear cell sarcoma of kidney (n = 13), Ewing sarcoma (n = 95), osteosarcoma (n = 87), and rhabdomyosarcoma (n = 42). Each data point is an individual tumor or normal tissue sample. The error bars represent the mean ± SD. The p values were calculated using the Mann-Whitney U test and are a comparison of each tumor cohort with skeletal muscle. |