
- Title
-
Oxoeicosanoid signaling mediates early antimicrobial defense in zebrafish
- Authors
- Ma, Y., Hui, K.L., Gelashvili, Z., Niethammer, P.
- Source
- Full text @ Cell Rep.
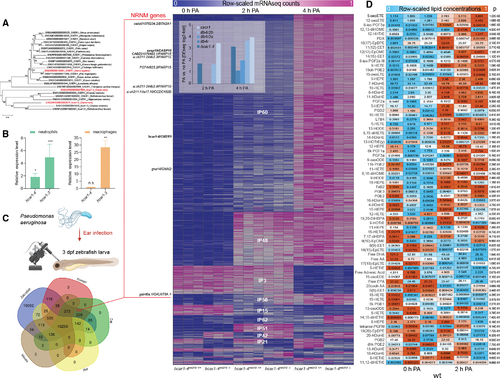
The 5-oxoETE pathway is induced by ear infection of zebrafish larvae with P. aeruginosa
(A) OXER1 phylogenetic tree. (B) Relative expression levels of hcar1–3 and hcar1–4 mRNA in leukocytes compared with the rest of the body determined by FACS-sorting of dissociated neutrophil (left panel, TG(lyz:pm2-mk2)) or macrophage (right panel, TG(mpeg1: eGFP)) reporter zebrafish larvae and qRT-PCR. Error bars, SD of three different pools of zebrafish leukocytes. *p < 0.05, **p < 0.01, ***p < 0.001, n.s., p > 0.05; Student’s t test (two tailed, two sample unequal variance test). (C) Top left panel: experimental cartoon scheme. This figure was created with BioRender. Bottom left panel: Venn diagram of zebrafish genes with ENSEMBL orthologs (ENSEMBL release 107) in human, cat, mouse, and rat. Red number, number of DIOPT-filtered NRNM genes (see STAR Methods). Right panel: sorted sGCA heatmap of significantly regulated mRNA-seq expression profiles (fold-regulation > 2, padj < 0.05 by Benjamini and Hochberg method) with high similarity to the respective binary expression phenotypes (correlation distance < 0.25, Figure S1B, also see STAR Methods and MATLAB sGCA script). Color scale, mRNA-seq profiles are row-scaled between 0 (blue) and 1 (pink). Shown are three biological replicates per experimental condition. Heatmap inset: significant (padj < 0.05) fold-upregulation of select inflammatory receptor mRNAs 2 and 4 h after PA infection as calculated by DEseq2. DIOPT-filtered NRNM genes are marked on the left side of the heatmap (zebrafish gene/human ortholog). NRNM genes with “high”-ranked (criteria see STAR Methods) human orthologs are printed in bold. (D) Heatmap of row-scaled lipid concentrations as measured by LIPIDMAPS full panel eicosanoid mass spectroscopical analysis. Color scale, relative lipid concentrations are row-scaled between 0 (blue) and 1 (orange). Boxed numbers, absolute lipid concentrations in pmol/mg tissue (~μM). Note that the color scale does not represent these absolute lipid concentrations, but that it highlights the relative changes for each lipid. Shown are three biological replicates (i.e., ~400 3 dpf zebrafish larvae per pool) per experimental condition. Numbers right of heatmap, p values of Student’s t test (two tailed, two sample unequal variance test) comparing 0 h PA vs. 2 h PA. See also Figure S1 and Tables S1 and S2. |
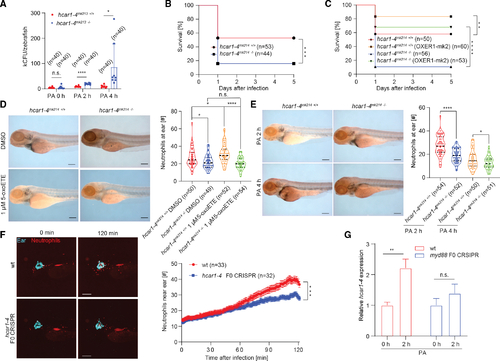
The 5-oxoETE pathway mediates early antimicrobial neutrophil recruitment to infection sites
(A) Colony forming units (CFU) per infected larvae at indicated times after infection. *p < 0.05; ****p < 0.00001; Student’s t test (two tailed, two sample unequal variance test). Error bars, SD of eight independently infected zebrafish pools (five larvae per group) comprising a total of n = 40 larvae per pool. (B and C) Meier-Kaplan survival plots of PA-infected hcar1–4mk214 +/+ (WT) and hcar1–4mk214 −/− larvae without (B) or with (C) ectopic expression of human OXER1 fused with mKate2 (OXER1-mk2). **p < 0.01; ***p < 0.001; ****p < 0.0001; log rank test. Parentheses, number of injected larvae per group. (D) 5-oxoETE-dependent neutrophil recruitment to infected ears requires hcar1–4. Larvae were injected with PA mixed with pure 5-oxoETE (in DMSO) or DMSO alone as vehicle control. During infection and incubation, the larvae were kept under isotonic bathing conditions (Iso E3) to suppress osmotic tissue damage signals as previously described in Huang and Niethammer, 2018.24 Left panel, representative images of Sudan-black-stained neutrophils at the infected ears of WT and hcar1–4mk214 −/− larvae 2 h after ear injection. Scale bar, 200 μm. Right panel, quantification of neutrophil counts at the ears at the indicated times after infection. Violin plots lines denote first quartiles (top line), medians (middle line), third quartiles (bottom line). Violin plot points denote neutrophil counts in individual larvae. *p < 0.05; ****p < 0.0001; n.s., p > 0.05; Student’s t test (two tailed, two sample unequal variance test). N, total number of injected larvae per condition. (E) Left panel: representative images of Sudan-black-staining of neutrophils at the infected ears of WT and hcar1–4mk214 −/− larvae. Scale bar, 200 μm. Right panel: quantification of neutrophil recruitment to the ears at the indicated times after infection. Violin plots lines denote first quartiles (top line), medians (middle line), and third quartiles (bottom line). Violin plot points denote neutrophil counts in individual larvae. *p < 0.05; ****p < 0.0001; Student’s t test (two tailed, two sample unequal variance test). Parentheses, total number of injected larvae. (F) Live imaging of neutrophil recruitment to ear in WT and hcar1–4 F0 CRISPR larvae (TG(lyz:pm2-mk2) background). Left panel: representative time-lapse images at indicated times after infection. Cyan, fluorescent beads co-injected with PA into the ear. Red, mKate2-expressing neutrophils. Scale bar, 200 μm. Right panel: neutrophil number in a 390 μm × 390 μm × 100 μm box around the ear counted by 3D segmentation of confocal imaging stacks. Error bar, SEM of n infected WT (red) or F0 CRSIPR (blue) larvae. ***p < 0.001; Student’s t test (two tailed, two sample unequal variance test) applied to the final time point (t = 120 min). (G) Relative mRNA expression levels of hcar1–4 at 2 h after PA ear infection as measured by qRT-PCR in 3 dpf zebrafish larvae (WT and myd88 F0 CRISPR). Actin was used as an internal control. Error bars, SD of three different pools of zebrafish larvae. **p < 0.01; n.s., p > 0.05; Student’s t test (two tailed, two sample unequal variance test). See also Figures S2 and S3. |
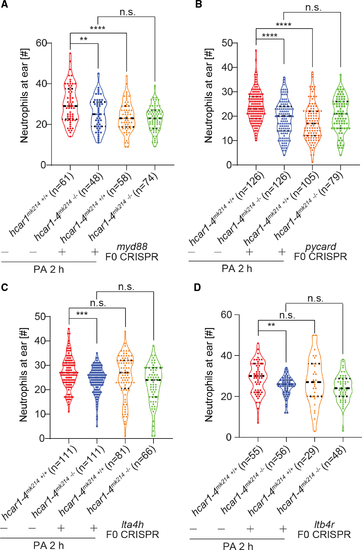
Oxoeicosanoid and not LTB4 signaling regulates early neutrophil recruitment along with microbial pattern recognition
(A and B) Myd88 and pycard mutations (F0 CRISPR) inhibit early neutrophil recruitment to infected ears to a similar extent as hcar1–4mk214 −/− mutation does but without having an additive effect to the latter. (C and D) Unlike the hcar1–4mk214 −/− mutation, lta4h and ltb4r F0 CRISPR mutations do not inhibit early neutrophil recruitment to infected ears. Violin plot points denote counts of Sudan-black-stained neutrophils in individual larvae. Violin plots lines denote first quartiles (top line), medians (middle line), and third quartiles (bottom line). **p < 0.01; ***p < 0.001; ****p < 0.0001; n.s., p > 0.05; Student’s t test (two tailed, two sample unequal variance test). Parentheses, total number of injected larvae. See also Figure S4. |
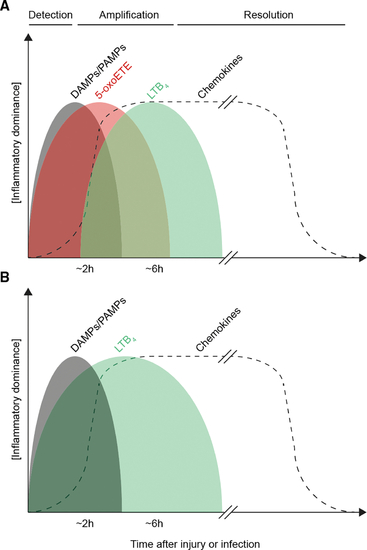
Hypothetical scheme of inflammatory mediator sequence after injury and infection
Hypothetical cartoon scheme of approximate regulatory timelines in (A) non-rodent and (B) rodent inflammation. DAMPs, damage associated molecular patterns. PAMPs, pathogen associated molecular patterns. |