
- Title
-
Dietary Supplementation with a Blend of Hydrolyzable and Condensed Tannins Ameliorates Diet-Induced Intestinal Inflammation in Zebrafish (Danio rerio)
- Authors
- Imperatore, R., Fronte, B., Scicchitano, D., Orso, G., Marchese, M., Mero, S., Licitra, R., Coccia, E., Candela, M., Paolucci, M.
- Source
- Full text @ Animals (Basel)
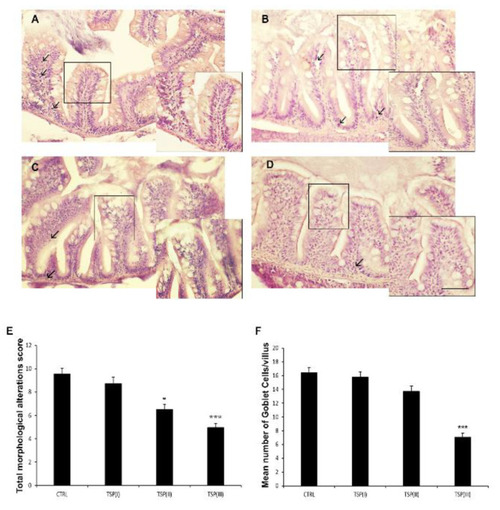
Hematoxylin and eosin (H&E) staining of intestines of (A) zebrafish fed a plant-based diet (control); (B) TSP I, zebrafish fed a plant-based diet supplemented with TSP at 0.9 g/kg of feed; (C) TSP II, zebrafish fed a plant-based diet supplemented with TSP at 1.7 g/kg of feed; and (D) TSP III, zebrafish fed a plant-based diet supplemented with TSP at 3.4g/kg of feed. Scale bar: 100 μm; 50 μm for the higher magnifications. Arrows indicate leucocyte infiltrates; linear boxes depict goblet cells. (E) Bar graph showing the total morphological alteration score (based on the modification of intestinal folds and gut lumen and increases in the numbers of goblet cells and leukocytes) defined for the intestines of each zebrafish group. Data are expressed as means ± SEs. * p < 0.05, *** p < 0.0001 compared to the control group. (F) Bar graph showing the mean number of goblet cells/villi in the intestines of each zebrafish group. Alcian Blue staining was used to count the goblet cells. Data are expressed as means ± SEs. *** p < 0.0001 compared to the control group. |

TNFα immunostaining in the intestines of (A) zebrafish fed a plant-based diet (control); (B) TSP I, zebrafish fed a plant-based diet supplemented with TSP at 0.9 g/kg of feed; (C) TSP II, zebrafish fed a plant-based diet supplemented with TSP at 1.7 g/kg of feed; and (D) TSP III, zebrafish fed a plant-based diet supplemented with TSP at 3.4 g/kg of feed. Scale bar: 100 μm. Arrows indicate epithelial cells, and black arrowheads indicate infiltrated leukocytes expressing TNFα. |

COX2 immunostaining in the intestines of (A) zebrafish fed the control diet; (B) TSP I, zebrafish fed the control diet supplemented with TSP at 0.9 g/kg of feed; (C) TSP II, zebrafish fed the control diet supplemented with TSP at 1.7 g/kg of feed; and (D) TSP III, zebrafish fed a diet enriched with TSP at 3.4 g/kg of feed. Scale bar: 100 μm. Arrows indicate COX2 expression on the apical side of epithelial cells. |

Relative mRNA expression of inflammatory factors in the intestines of zebrafish fed a plant-based diet (control—CTRL) (black column) or a plant-based diet supplemented with TSP at 0.9 g/kg of feed (TSP I), 1.7 g/kg of feed (TSP II), or 3.4 g/kg of feed (TSP III). Only the significant differences are reported. Error bars represent the standard errors of the means (SEMs). **** p < 0.00001, *** p < 0.0001, ** p < 0.001, * p < 0.05. |
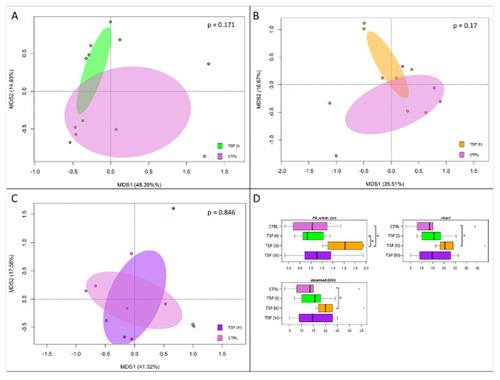
Beta diversity and alpha diversity of the gut microbiota of zebrafish fed a control diet (CTRL), zebrafish fed a diet supplemented with TSP at 0.9 g/kg of feed (TSP I), zebrafish fed a diet supplemented with TSP at 1.7 g/kg of feed (TSP II), and zebrafish fed a diet enriched with TSP at 3.4 g/kg of feed (TSP III). PCoA based on unweighted UniFrac distances between gut microbiota structures of CTRL zebrafish and TSP I (A), TSP II (B), and TSP III (C) zebrafish. In all PCoA plots, samples are not significantly separated (permutation test with pseudo-F ratio, p > 0.05). (D) Boxplots of alpha diversity, measured with Faith’s phylogenetic diversity (PD_whole_tree), Chao1 index, and observed_ASVs. For only the TSP II group, higher values of alpha diversity were observed for all metrics compared to the plant-based-diet group (Wilcoxon rank-sum test, * p ≤ 0.05). |
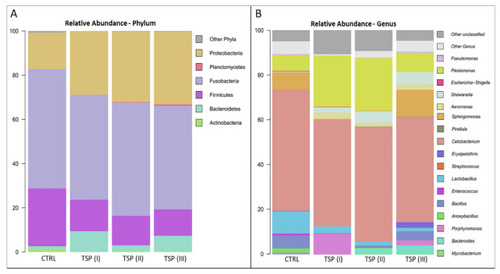
Microbiome compositions of the whole intestines of zebrafish fed a control diet (CTRL), zebrafish fed a diet supplemented with TSP at 0.9 g/kg of feed (TSP I), zebrafish fed a diet supplemented with TSP at 1.7 g/kg of feed (TSP II), and zebrafish fed a diet enriched with TSP at 3.4 g/kg of feed (TSP III). Bar plots summarizing the microbiota compositions at the phylum (A) and genus levels (B) of CTRL, TSP I, TSP II, and TSP III intestines. Only phyla and genera with relative abundances ≥ 0.5% in at least 2 samples are represented. |
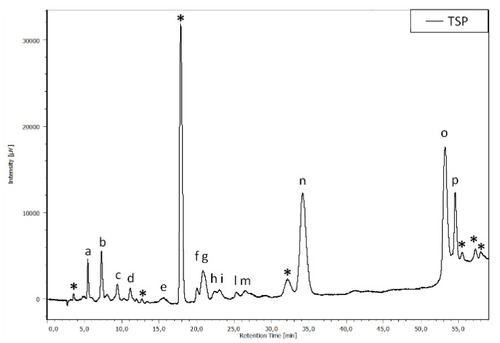
Chromatographic profile, acquired at 280 nm, of the TSP. The asterisks refer to the condensed tannins; the letters (a–p) refer to the hydrolyzable tannins. |