
- Title
-
Deficiency of Adipose Triglyceride Lipase Induces Metabolic Syndrome and Cardiomyopathy in Zebrafish
- Authors
- Lai, H.H., Yeh, K.Y., Hsu, H.M., Her, G.M.
- Source
- Full text @ Int. J. Mol. Sci.
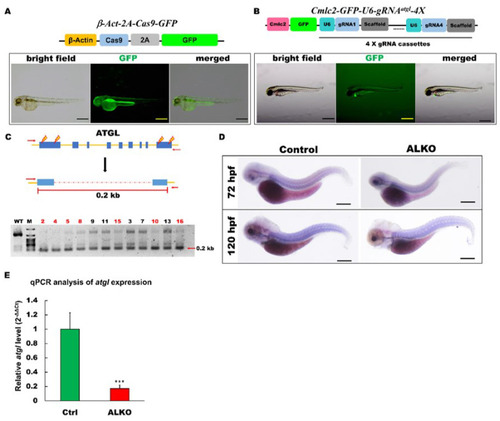
Generation of zebrafish ALKO mutant using CRIPRC-Cas9 system. (A) Schematics of the structure of β-Act-2A-Cas9-GFP expression vector. The transcriptional activity of Cas9 elements (sky blue) was driven by β-actin 2.5k promoter (yellow). The lower panel shows the fluorescence pattern of Tg (β-Act-2A-Cas9-GFP) with a global expression of GFP at 2 days post-fertilization (dpf). Scale bar: 500 μm. (B) Schematics of the structure of Cmlc2-GFP-U6-gRNAatgl-4X expression vector. The GFP expression represented the success of transgenesis of Tg (Cmlc2-GFP-U6-gRNAatgl-4X) at 5 dpf. Scale bar: 600 μm. (C) Upper: Schematic diagram of the outer primers of atgl loci used for PCR detection of mutations. The outer primers are to the mutated site/scheme of the locations of PCR primers (red arrows) designed to detect a disruption in the spacer between the first exon and the last one. Yellow lightening symbols denote the site of four selective gRNAs; navy blue boxes denote all of the exons in the atgl loci; red dashed line denotes the spacer; red line denotes the length between external primers without the spacer. Lower: Result of semi-qRT–PCR analyses on the whole embryo of transient F0 fish containing the corresponding mutations (as indicated in the upper panel of C). (D) Whole-mount in situ hybridization showing the reduction of atgl in ALKO mutant larvae at 120 hpf. Scale bars = 80 μm. (E) Quantitative of atgl expression by RT-qPCR analysis at 7 dpf. Heterozygous ALKO mutants were generated by cross-homozygous Tg (β-Act-2A-Cas9-GFP) and Tg (Cmlc2-GFP-U6-gRNAatgl-4X). Control: Heterozygous Tg (Cmlc2-GFP-U6-gRNAatgl-4X). *** (p < 0.001) indicates statistically significant differences from the controls. Value of atgl in ALKO = 0.1721 ± 0.0421. |
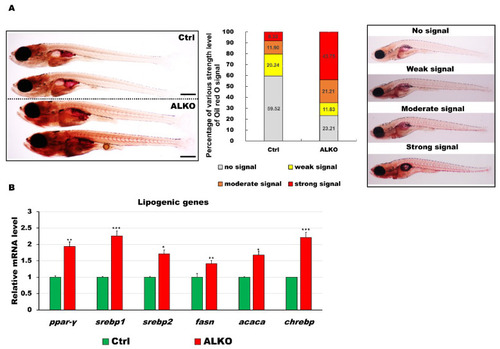
Defective Atgl led to energy imbalance and hyperlipidemia/hyperglycemia in ALKO larvae/adults. (A) Whole-mount Oil Red O staining of control (Heterozygous Tg (Cmlc2-GFP-U6-gRNAatgl-4X)) and ALKO at 21 dpf. Scale bar: 100 μm. Percentages of control and ALKO larvae with no, weak, moderate, and strong levels of lipidemia at 21 dpf were presented in the middle panel. (B) Molecule analysis of ALKO at 45 dpf represented an upregulation of the lipogenic genes peroxisome proliferator-activated receptor gamma (ppar-γ), sterol regulatory element binding transcription factor 1 (srebp1), sterol regulatory element binding transcription factor 2 (srebp2), fatty acid synthase (fasn), acetyl-CoA carboxylase alpha (acaca), and carbohydrate-responsive element-binding protein (chrebp). Values of ppar-y = 1.9410 ± 0.0608, srebp1 = 2.2597 ± 0.0562, srebp2 = 1.7098 ± 0.0290, fasn = 1.4120 ± 0.0356, acaca = 1.6749 ± 0.0640, and chrebp = 2.2168 ± 0.1528 in ALKO group. Statistically significant differences from the controls are indicated by * p < 0.05, ** p < 0.01, and *** p < 0.001. |
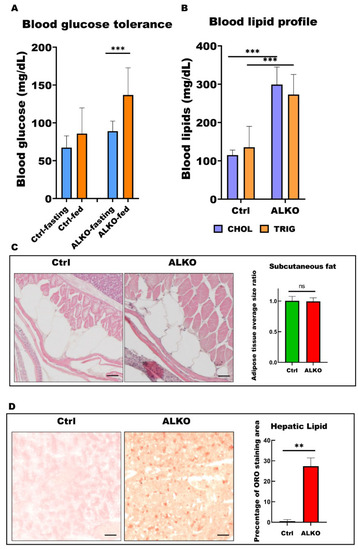
ALKO presented a typical metabolic syndrome outcome in adult. (A) Blood glucose contents of control and ALKO adults 5-month post-fertilization (mpf) at fasting and 90 mins after feeding. Values of Ctrl-fasting = 67.3636 ± 15.4872, Ctrl-fed = 85.75 ± 34.0619, ALKO-fasting = 89 ± 13.2581, and ALKO-fed = 136.833 ± 35.9415. (B) Blood lipid contents of control and ALKO adults at 5 mpf. CHOL: Total cholesterol content (mg/dL); TRIG: Total triglyceride content (mg/dL). Values of CHOL in Ctrl = 115 ± 13.2288, and ALKO = 299 ± 45.9239. Values of TRIG in Ctrl = 135.667 ± 54.3722, and AKOL = 273 ± 52.5071. (C) Characterization of subcutaneous fat in ALKO and control at 5 mpf. Scale bar: 50 μm. Values of adipose tissue average size ratio in Ctrl = 1.0041 ± 0.0738, and ALKO = 0.9946 ± 0.0595. (D) Histological images of hepatic ORO sections revealed a non-alcohol fatty liver phenotype in ALKO at 5 mpf. Scale bar: 50 μm. Percentage of ORO staining area in Ctrl = 0.481 ± 0.7925, and ALKO = 27.356 ± 4.0251. Statistically significant differences from the controls are indicated by ** p < 0.01, and *** p < 0.001. |
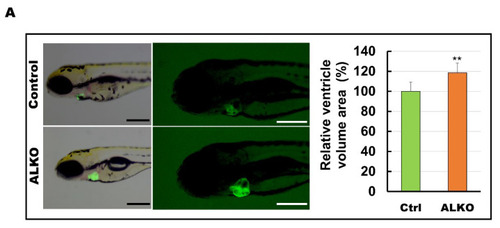
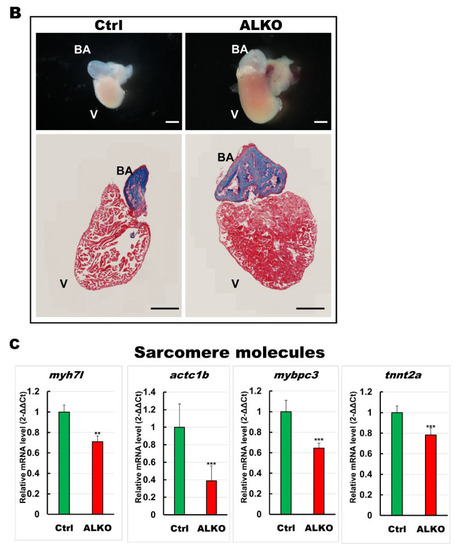
Hypertrophic hearts are evident in ALKO zebrafish in the larvae/adult stage. (A) Defective Atgl enlarged the ventricle size in ALKO at 5 dpf. Scale bar: 500 μm. The relative ventricle area was measured by the ventricle area of the control and ALKO 5 dpf embryo. Percentage of ventricle volume area in Ctrl = 100 ± 8.0138, and ALKO = 118.6974 ± 12.1794. (Control, n = 9; ALKO, n = 11). (B) Upper: The later view of the hearts in control and ALKO at 5 mpf. Lower: Paraffin-embedded sections of the hearts of control and ALKO at 5 mpf with Masson trichrome stained. Scale bar: 200 μm. B.A.: bulbus arteriosus, V: ventricle. (C) Molecule analysis of ALKO demonstrated the downregulation of sarcomere genes in the ventricle of 5 mpf ALKO (n = 3). Values of myh7l = 0.7088 ± 0.0564, actc1b = 0.3882 ± 0.145, mybpc3 = 0.6449 ± 0.0474, and tnnt2a = 0.7824 ± 0.0671 in ALKO group. Statistically significant differences from the controls are indicated by ** p < 0.01, and *** p < 0.001. |
Hypertrophic hearts are evident in ALKO zebrafish in the larvae/adult stage. (A) Defective Atgl enlarged the ventricle size in ALKO at 5 dpf. Scale bar: 500 μm. The relative ventricle area was measured by the ventricle area of the control and ALKO 5 dpf embryo. Percentage of ventricle volume area in Ctrl = 100 ± 8.0138, and ALKO = 118.6974 ± 12.1794. (Control, n = 9; ALKO, n = 11). (B) Upper: The later view of the hearts in control and ALKO at 5 mpf. Lower: Paraffin-embedded sections of the hearts of control and ALKO at 5 mpf with Masson trichrome stained. Scale bar: 200 μm. B.A.: bulbus arteriosus, V: ventricle. (C) Molecule analysis of ALKO demonstrated the downregulation of sarcomere genes in the ventricle of 5 mpf ALKO (n = 3). Values of myh7l = 0.7088 ± 0.0564, actc1b = 0.3882 ± 0.145, mybpc3 = 0.6449 ± 0.0474, and tnnt2a = 0.7824 ± 0.0671 in ALKO group. Statistically significant differences from the controls are indicated by ** p < 0.01, and *** p < 0.001. |
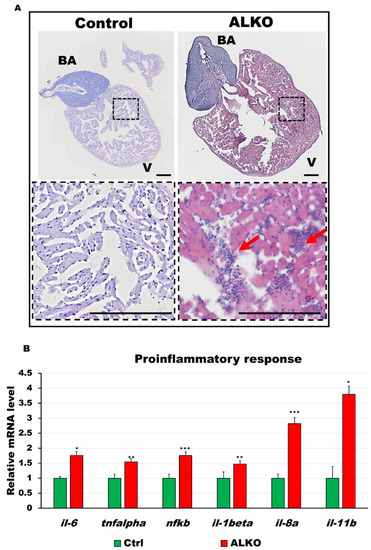
Depletion of Atgl activated immune response in the ventricle of ALKO. (A) Hematoxylin and eosin-stained sections of whole hearts of control and ALKO at 5 mpf. Scale bar: 100 μm. B.A.: bulbus arteriosus, V: ventricle. (B) Upregulated proinflammatory markers of ALKO ventricles revealed by RT-qPCR. In the ALKO group, il6 = 1.7615 ± 0.0834, tnfalpha = 1.5474 ± 0.2950, nfkb = 1.7564 ± 0.4665, il-1beta = 1.4744 ± 0.0689, and il-11b = 3.7973 ± 0.7233. Statistically significant differences from the controls are indicated by * p < 0.05, ** p < 0.01, and *** p < 0.001. |
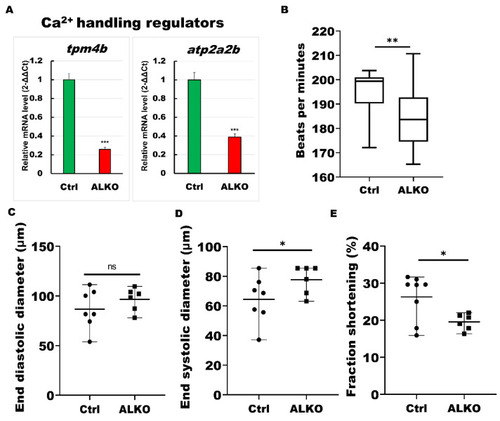
ALKO developed a dysfunctional heart. (A) RT-qPCR of ALKO ventricles at 5 mpf represented downregulation of calcium handling regulators: tropomyosin 4-2 (tpm4b) and ATPase sarcoplasmic/endoplasmic reticulum Ca2+ transporting 2b (atp2a2b). In ALKO group, values of tpm4b = 0.258 ± 0.0201 and atp2a2b = 0.3882 ± 0.0341. (B) Heart rate assay revealing ventricle contraction. The heart rhythm analysis displayed impaired cardiac function in the ALKO compared to the control group at 120 hpf. Values of Ctrl = 194.538 ± 11.5407 and ALKO = 184.304 ± 13.0617. (C) End diastolic diameter showed no significant difference in ALKO group. Values of Ctrl = 86.7763 ± 19.9123 and ALKO = 96.595 ± 11.7485. (D) End systolic diameter increased in 120 hpf ALKO larvae. Values of Ctrl = 64.4851 ± 15.8247 and ALKO = 77.7095 ± 9.718. (E) The fraction shortening assay showed that the ALKO group exhibited a significant decrease compared to the control group. The fraction shortening, calculated as end-diastolic diameter (EDD) and end-systolic diameter (ESD), was measured in % as FS% = (EDD-ESD)/(EDD) × 100%. Percentage of Ctrl = 26.284 ± 6.1512 and ALKO = 19.5556 ± 2.185. Statistically significant differences from the controls are indicated by * p < 0.05, ** p < 0.01, and *** p < 0.001. |
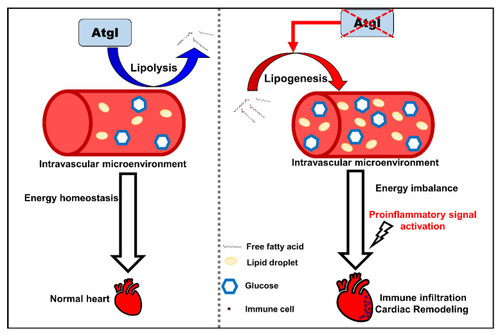
The schematic diagram summarizes the findings in this study. Defective Atgl activated lipogenic pathway leads to an energy imbalance microenvironment in the circulation system. Excess metabolites enhance cardiac remodeling by activating proinflammatory signals and immune cell recruitment. |